I was asked by one of my clients who purchased the PLATINUM package for Stock and Crypto Analysis Request credits why SFI has a Surveillance Intervention market status.
I did not bother asking my client’s broker because I see that market status a lot on COL Financial’s platform.
Every when do I see the Surveillance Intervention value for Market Status?
I see that for all stocks during non-trading hours.
Then, about 30 to 60 minutes before the pre-open period, the Market Status changes from Surveillance Intervention to Start of Consultation.
Then, during trading hours, the status becomes “Continuous trading“.
Now, I understand why the Surveillance Intervention market status is quite bothersome, by a certain degree, if you’re a relatively new stock trader.
For one, you might be thinking, “What wrong did this company do for it to become under close monitoring?”
How to Know if the PSE-listed Company Is Officially Under a Regulatory Body’s Surveillance?
If you want to be 100% sure if the publicly-listed company committed any violation or if it’s officially under the monitoring of the Philippine Stock Exchange or the Capital Markets Integrity Corp. (CMIC), I advise that you check the Disclosures tab of that specific company on PSE Edge’s website.
If there’s no official disclosure pertaining to the company being under surveillance, then, it is safe to not to worry about the Surveillance Intervention market status on COL Financial’s platform.
By the way, I already tried to search for an explainer or any material on COL Financial’s website that enumerates and explains all values we can expect to read next to the Market Status row, but I couldn’t find one.
If you are a COL Financial’s authorized representative who can list down and provide an explanation to all the statuses that appear next to the Market Status column on your platform, feel free to reach out to me so I can update this article for the benefit of the thousands of COL Financial clients who regularly read my articles.
Since we’re already talking about a company being under surveillance, I’d like to stretch this topic to a case when a publicly-listed company is officially under the surveillance of the concerned authorities.
When unusual or abnormal trading activities are observed in the market, a stock can be placed under surveillance intervention status.
The triggers and criteria for this status vary depending on the involved stock exchange and regulatory bodies.
What Can Put a PSE-listed Company Under Official Surveillance?
I’ll tell you some common scenarios that can prompt surveillance:
- Significant price movements, such as sudden sharp increases or decreases, can act as triggers for surveillance intervention. The purpose is to ensure that the stock’s price is not influenced by market manipulation or insider trading.
- Surveillance intervention may be attracted by abnormally high trading volume in a stock, which could indicate potential unauthorized trading activities or manipulation.
- Suspicions of price manipulation, including the spread of false information or engagement in fraudulent trading practices, may lead to surveillance of the stock.
- Allegations or suspicions of insider trading, where individuals with privileged information trade the stock, have the potential to trigger surveillance intervention.
- Any violation of the rules, regulations, or listing requirements of the stock exchange can result in surveillance intervention. This encompasses non-compliance with reporting obligations, financial irregularities, or failure to meet listing standards.
Specific actions taken during surveillance intervention can vary.
How I Make Decisions Earlier than an Official Disclosure Stating a PSE-listed Company Is Under Surveillance?
In my case, I don’t need to wait for an official disclosure to be published on PSE Edge to get a “data-oriented feel or hunch” if something fishy is going on in the bid and ask spread.
The trade and volume charts in my proprietary Dominant Range Index indicator shows me some noteworthy imbalances between the size of the volume and the number of trades made for all traded price points for a particular stock within a particular period.
I know you need to see a sample or two so you can visualize and appreciate what I’m telling you.
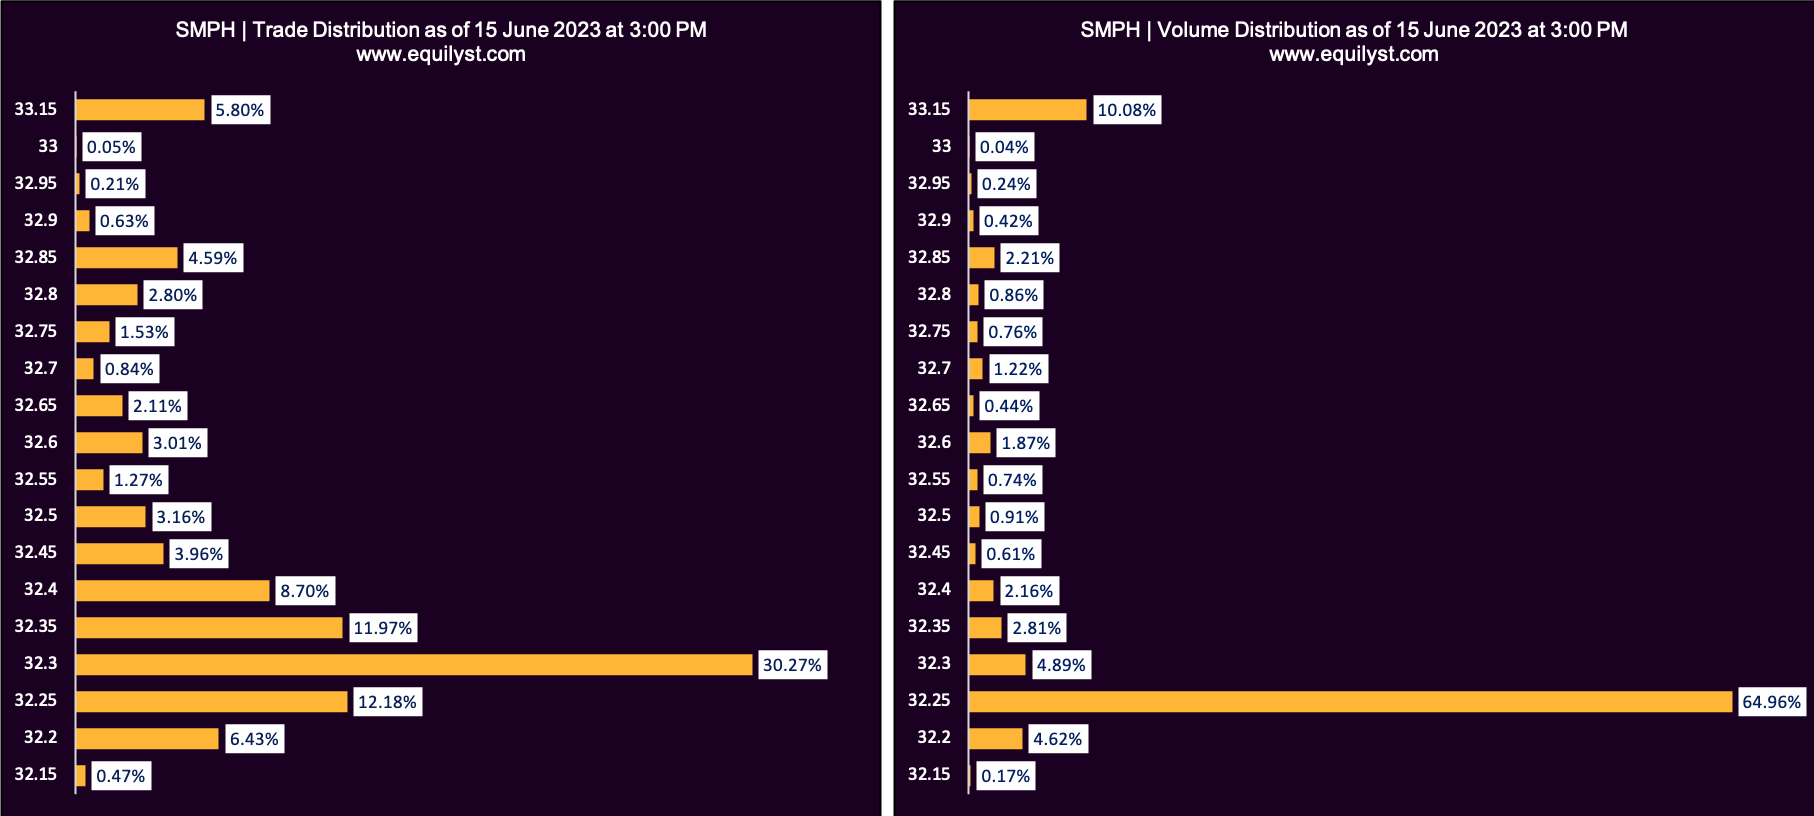
Let’s use SMPH’s trade-volume distribution chart as an example.
 This chart was as of closing on June 15, 2023.
Did you notice that despite the more than 30% share of all trades transacted, only 4.89% of all volumes transacted happened at P32.30?
I call that an imbalance on trade-volume distribution.
Did a group of traders artificially bloat the size of trades at P32.30 to cultivate an artificial bearish sentiment to make you and I think that there’s still no strong appetite to buy the stock at a higher price?
Why would someone or a group do that?
It is for them to be the first to buy at more attractive prices, preferably lower than the prevailing volume-weighted average price, so they’ll be the first to sell and lock-in profits as well when non-suspecting, gullible traders start to follow suit.
Let me ask you: did SMPH have a red or green Day Change on June 16?
SMPH went up by 2.56% on June 16, 2023.
It opened at P33.10.
If you wanted to top up on your existing portfolio of SMPH shares on June 16, at what range of prices would you park your transaction?
Of course, you would park it at or near the dominant range, which is near the intraday low of June 15th trading.
Does my proprietary methodology (Evergreen Strategy) make me a FOMO (fear of missing out)-proof trader and investor?
It’s either you respond with a deafening YES or deny me an applause due to insecurity.
Is my trade-volume distribution analysis only useful when the dominant range is closer to the intraday low than the intraday high?
Who’s the Marites that told you that? Of course, not!
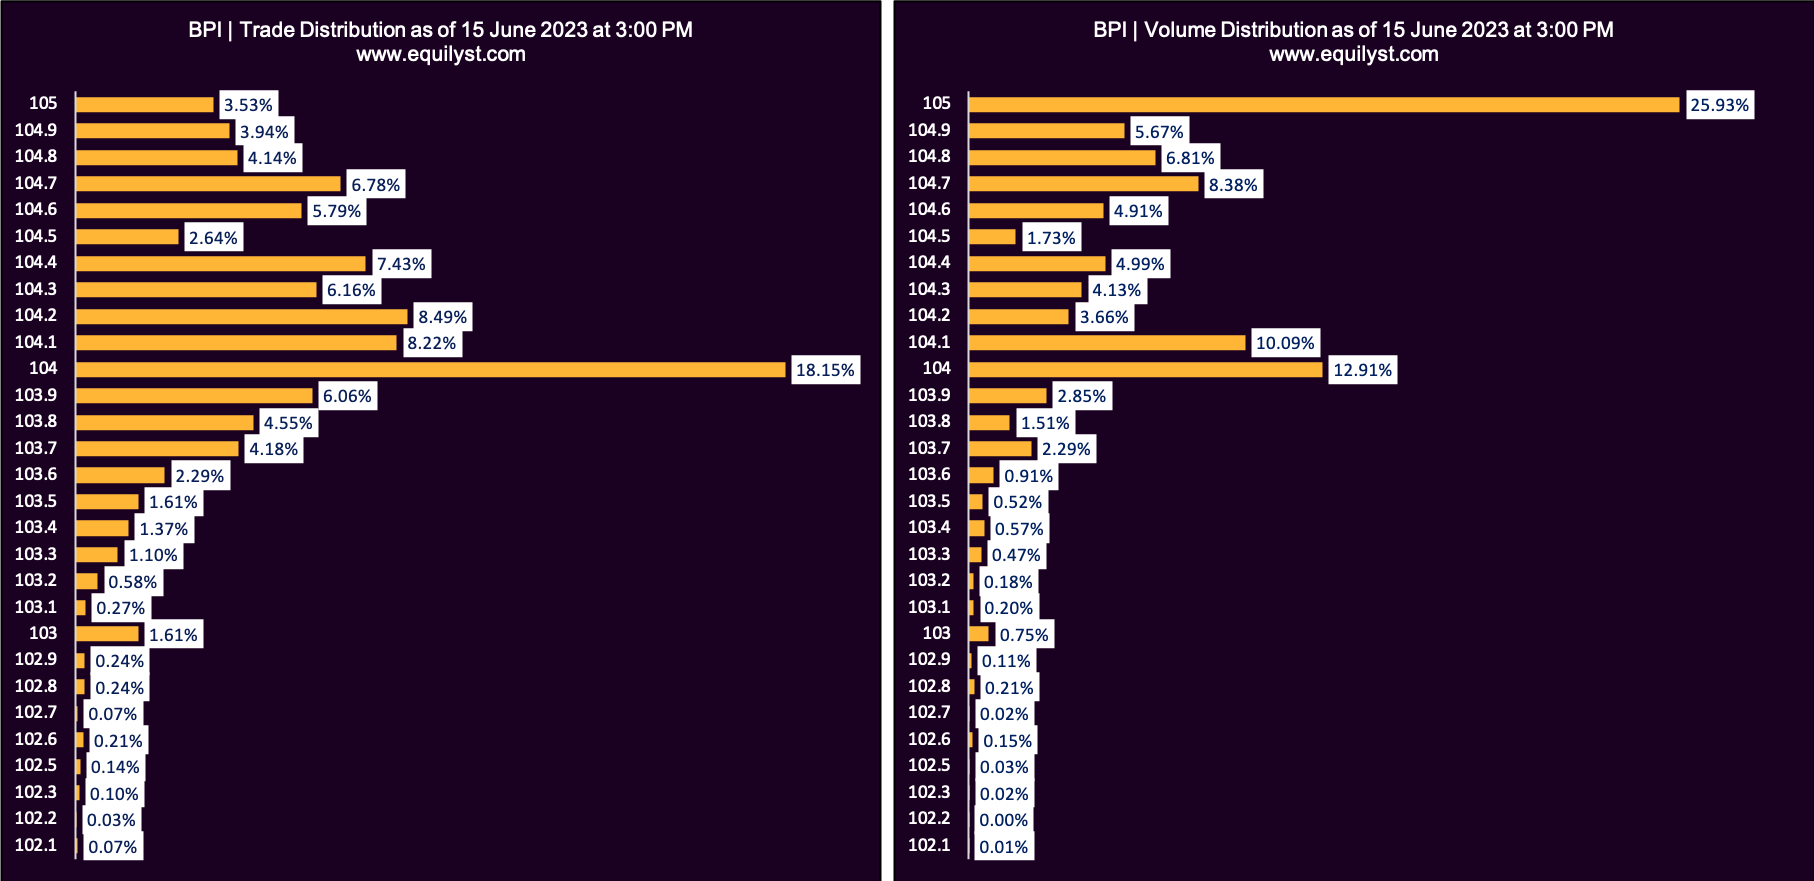
I’ll show you BPI’s trade-volume distribution chart as of closing on June 15, 2023.
 In this case, the dominant range is closer to the intraday high than the intraday low.
The dominant range is between P104 and P105.
This picture is very useful whether you’d like to sell on strength or buy more shares.
If you planned to sell some shares or your entire holding the next day (June 16), my advice would be to position between P104 and P105.
Why?
Of course, your transaction was more likely to be processed within the P104-P105 range.
You don’t want to waste your time parking your transaction 20% lower than the intraday low everyday, only to wake up on a Saturday morning realizing you did nothing for the entire week but day-dreamed that someone crazy out there would sell at a price ridiculously lower than what’s necessary.
By the way, BPI closed on June 16 on a positive note, up by 1.9%.
Interested to Learn My Methodology?
Check the services of Equilyst Analytics here.
- MA, BDO, ALI, URC, PX: Is Their Dominant Range Pointing to a Breakout? - March 14, 2025
- Tracking Market Sentiment: MTD Ratings for 30 Bluechip Stocks (March 2025) - March 13, 2025
- PSEi Stalls Below 6,260 as Market Awaits Political Shift - March 12, 2025


