Successful stock trading requires the ability to analyze market trends and identify potential entry and exit points. One powerful tool that traders use for this purpose is the Relative Strength Index (RSI). RSI helps investors determine when a stock is considered oversold or overbought, providing valuable insights into potential price reversals. In this article, I will talk about the concept of oversold and overbought conditions and how RSI can help you make informed decisions.
I’d like to inform you that even though I’m going to discuss RSI in this article, it isn’t part of my methodology when identifying stocks with a confirmed buy signal. I have proprietary indicators that can do more than what RSI can (e.g. Dominant Range Index and Market Sentiment Index indicators). I am writing this article for those of you who would like to start with classical technical indicators, such as the RSI.
What Is RSI?
The Relative Strength Index (RSI) is a momentum oscillator that measures the speed and change of price movements. Developed by J. Welles Wilder in the late 1970s, RSI is widely used by traders and analysts to gauge the strength and weakness of a stock’s price movements. It oscillates between 0 and 100, with readings above 70 indicating overbought conditions and readings below 30 indicating oversold conditions.
Some traders consider 20 as the oversold level while 80 as the overbought level. Don’t ask me which setting should be considered for overbought or oversold levels because I don’t use RSI in my methodology. Should you decide to use RSI in your strategy, I recommend that you back-test 20 and 30 for oversold levels and 70 and 80 for overbought levels. Then, see which settings give you a more satisfying result.
Oversold Conditions
When the RSI of a stock drops below the 30 level, it is generally considered to be in an oversold condition. This means that the stock may have experienced a significant downward price movement over a short period, and there is a potential for a price reversal to the upside. Traders often view oversold conditions as buying opportunities because the stock is perceived to be undervalued, and there may be potential for a rebound.
However, it’s important to note that an oversold condition does not guarantee an immediate price increase. It simply suggests that the stock may be due for a bounce or a period of consolidation before the uptrend begins. Traders should use other technical and fundamental analysis tools to confirm the potential for a reversal.
Overbought Conditions
Conversely, when the RSI of a stock rises above the 70 level, it is considered to be in an overbought condition. This suggests that the stock may have experienced a rapid and significant upward price movement, and there is a possibility of a price correction or reversal to the downside. Traders often interpret overbought conditions as potential selling opportunities because the stock is perceived to be overvalued, and there may be a risk of a pullback.
Again, it’s essential to understand that an overbought condition does not guarantee an immediate price decline. It simply indicates that the stock’s price may be due for a correction or a period of consolidation before the downtrend begins. Traders should use additional analysis to confirm the potential for a reversal.
Using RSI for Trading Decisions
- Divergence: One powerful way to use RSI is by looking for divergence between the RSI and the stock’s price. Bullish divergence occurs when the RSI forms higher lows while the stock’s price forms lower lows, indicating a potential bullish reversal. Conversely, bearish divergence occurs when the RSI forms lower highs while the stock’s price forms higher highs, suggesting a potential bearish reversal.
- Confirmation: RSI should be used in conjunction with other technical and fundamental analysis tools to confirm trading decisions. For example, traders may look for oversold conditions in a fundamentally strong company or overbought conditions in a fundamentally weak company to avoid false signals.
- Time Frame: The effectiveness of RSI can vary depending on the time frame used. Short-term traders may use shorter RSI periods (e.g., 14 days), while long-term investors may use longer periods (e.g., 50 days) to smooth out fluctuations.
Examples of Overbought and Oversold Stocks According to RSI
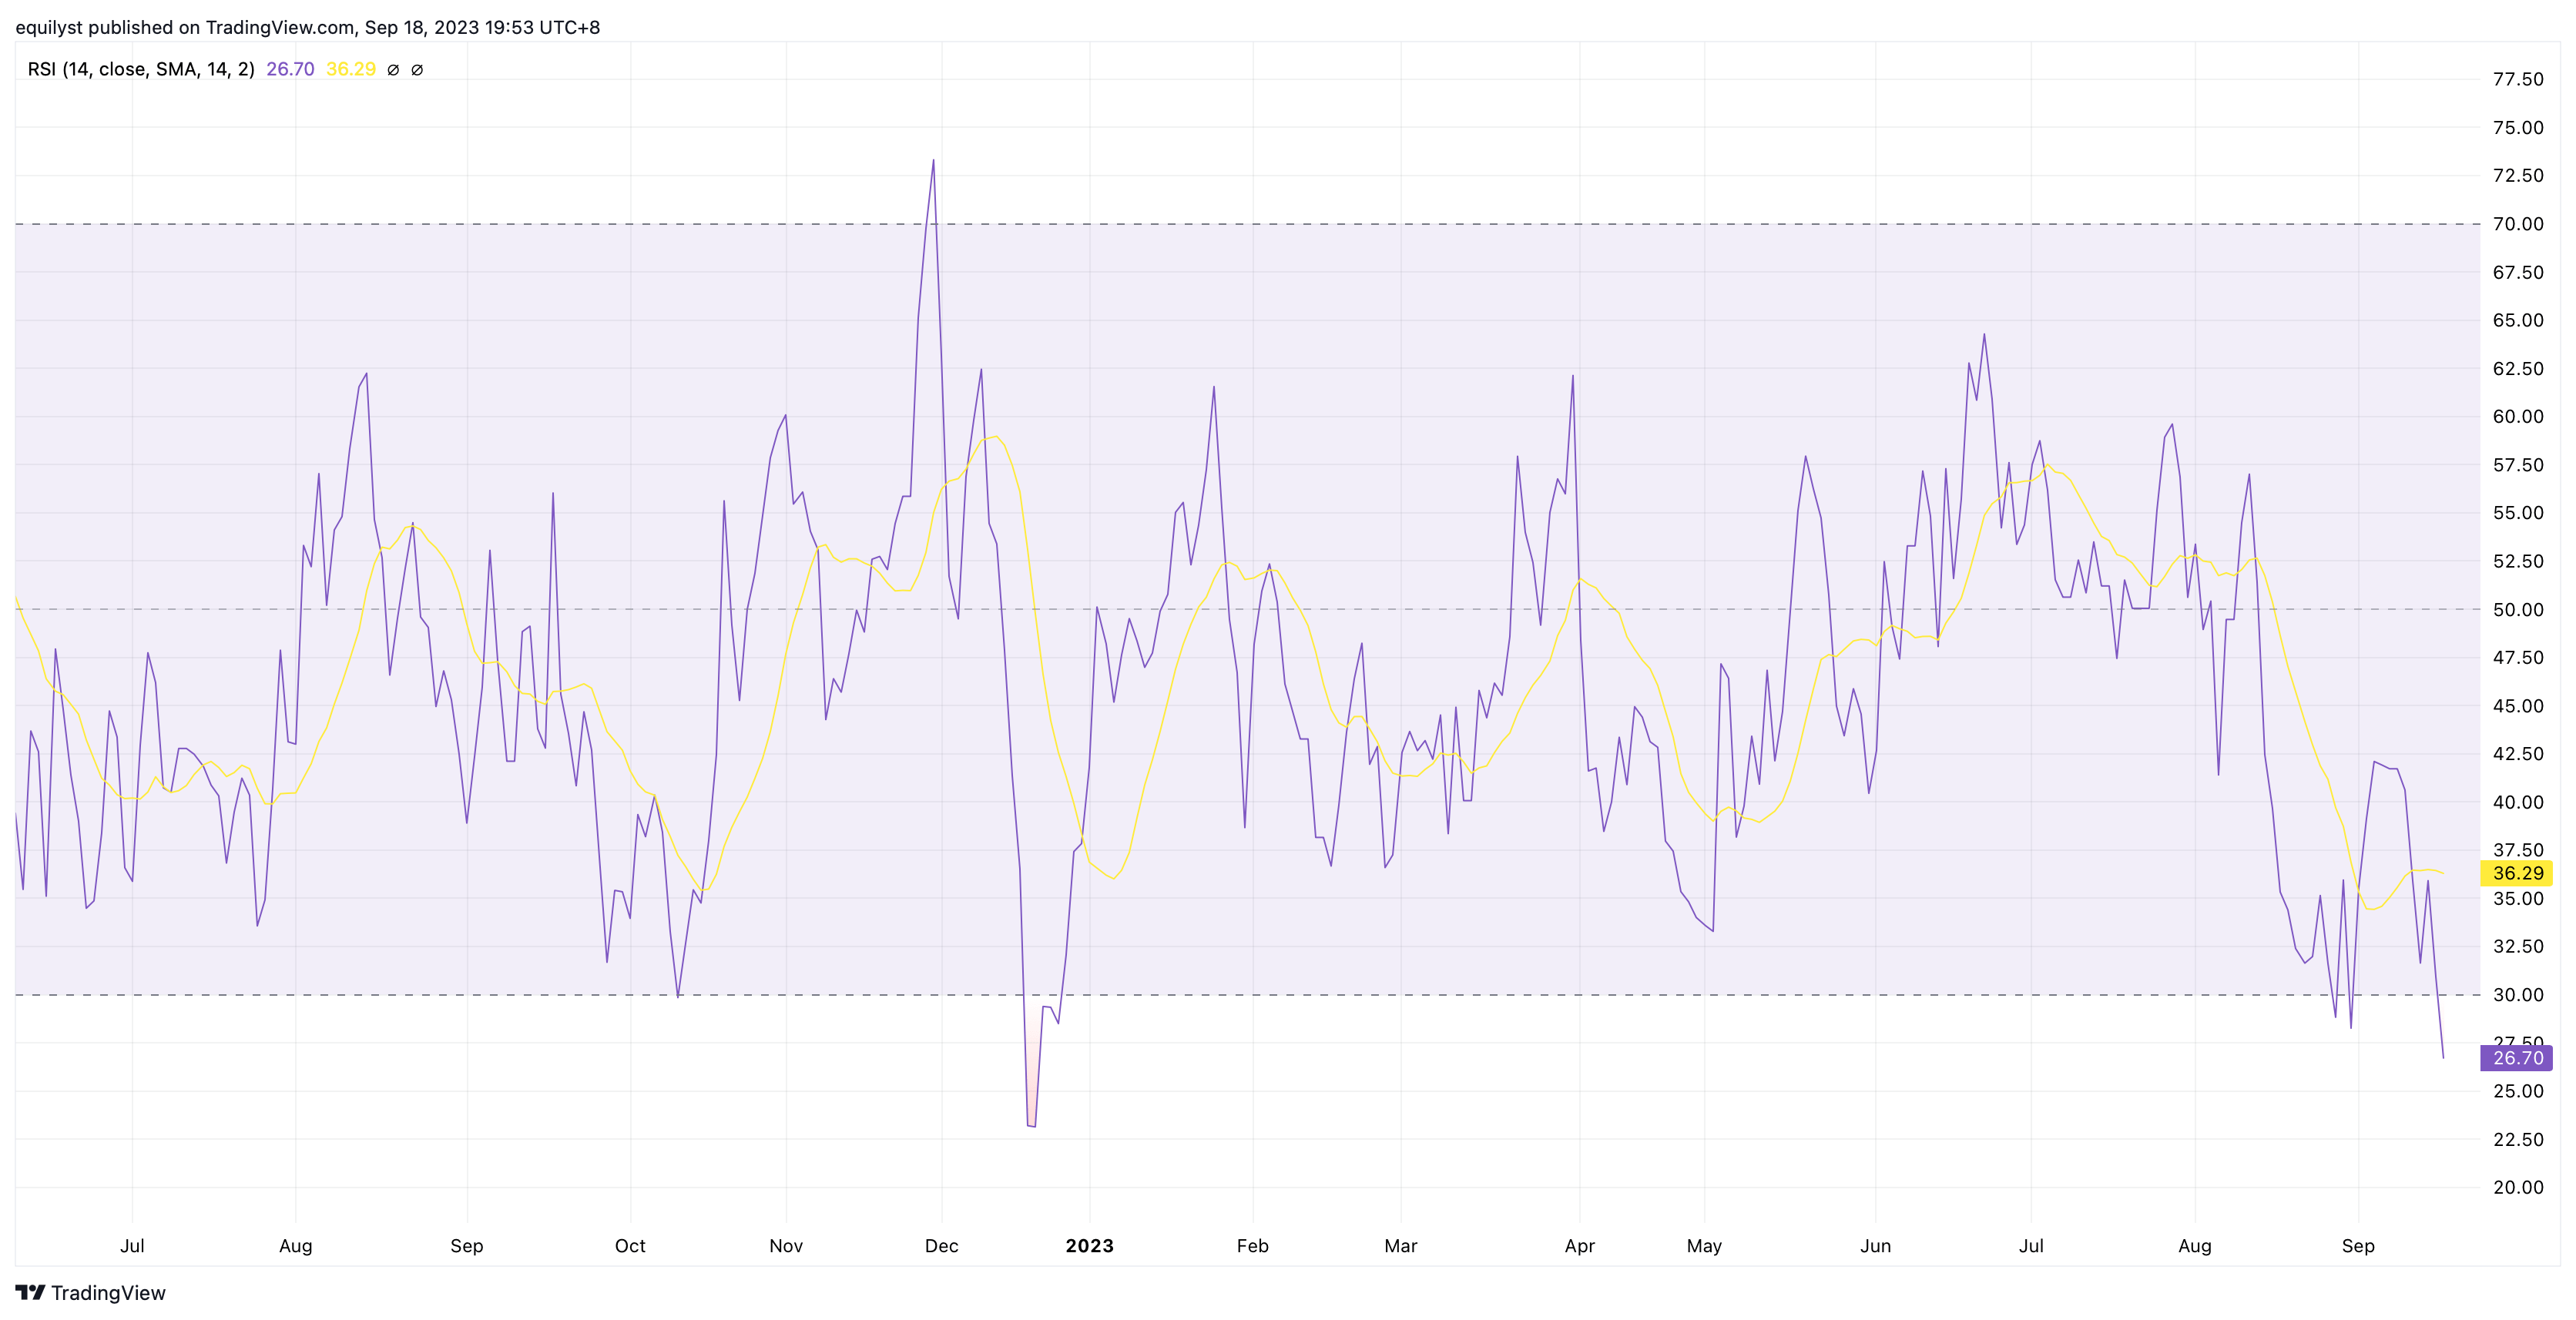
PLDT (TEL): RSI – 26.70 (oversold)
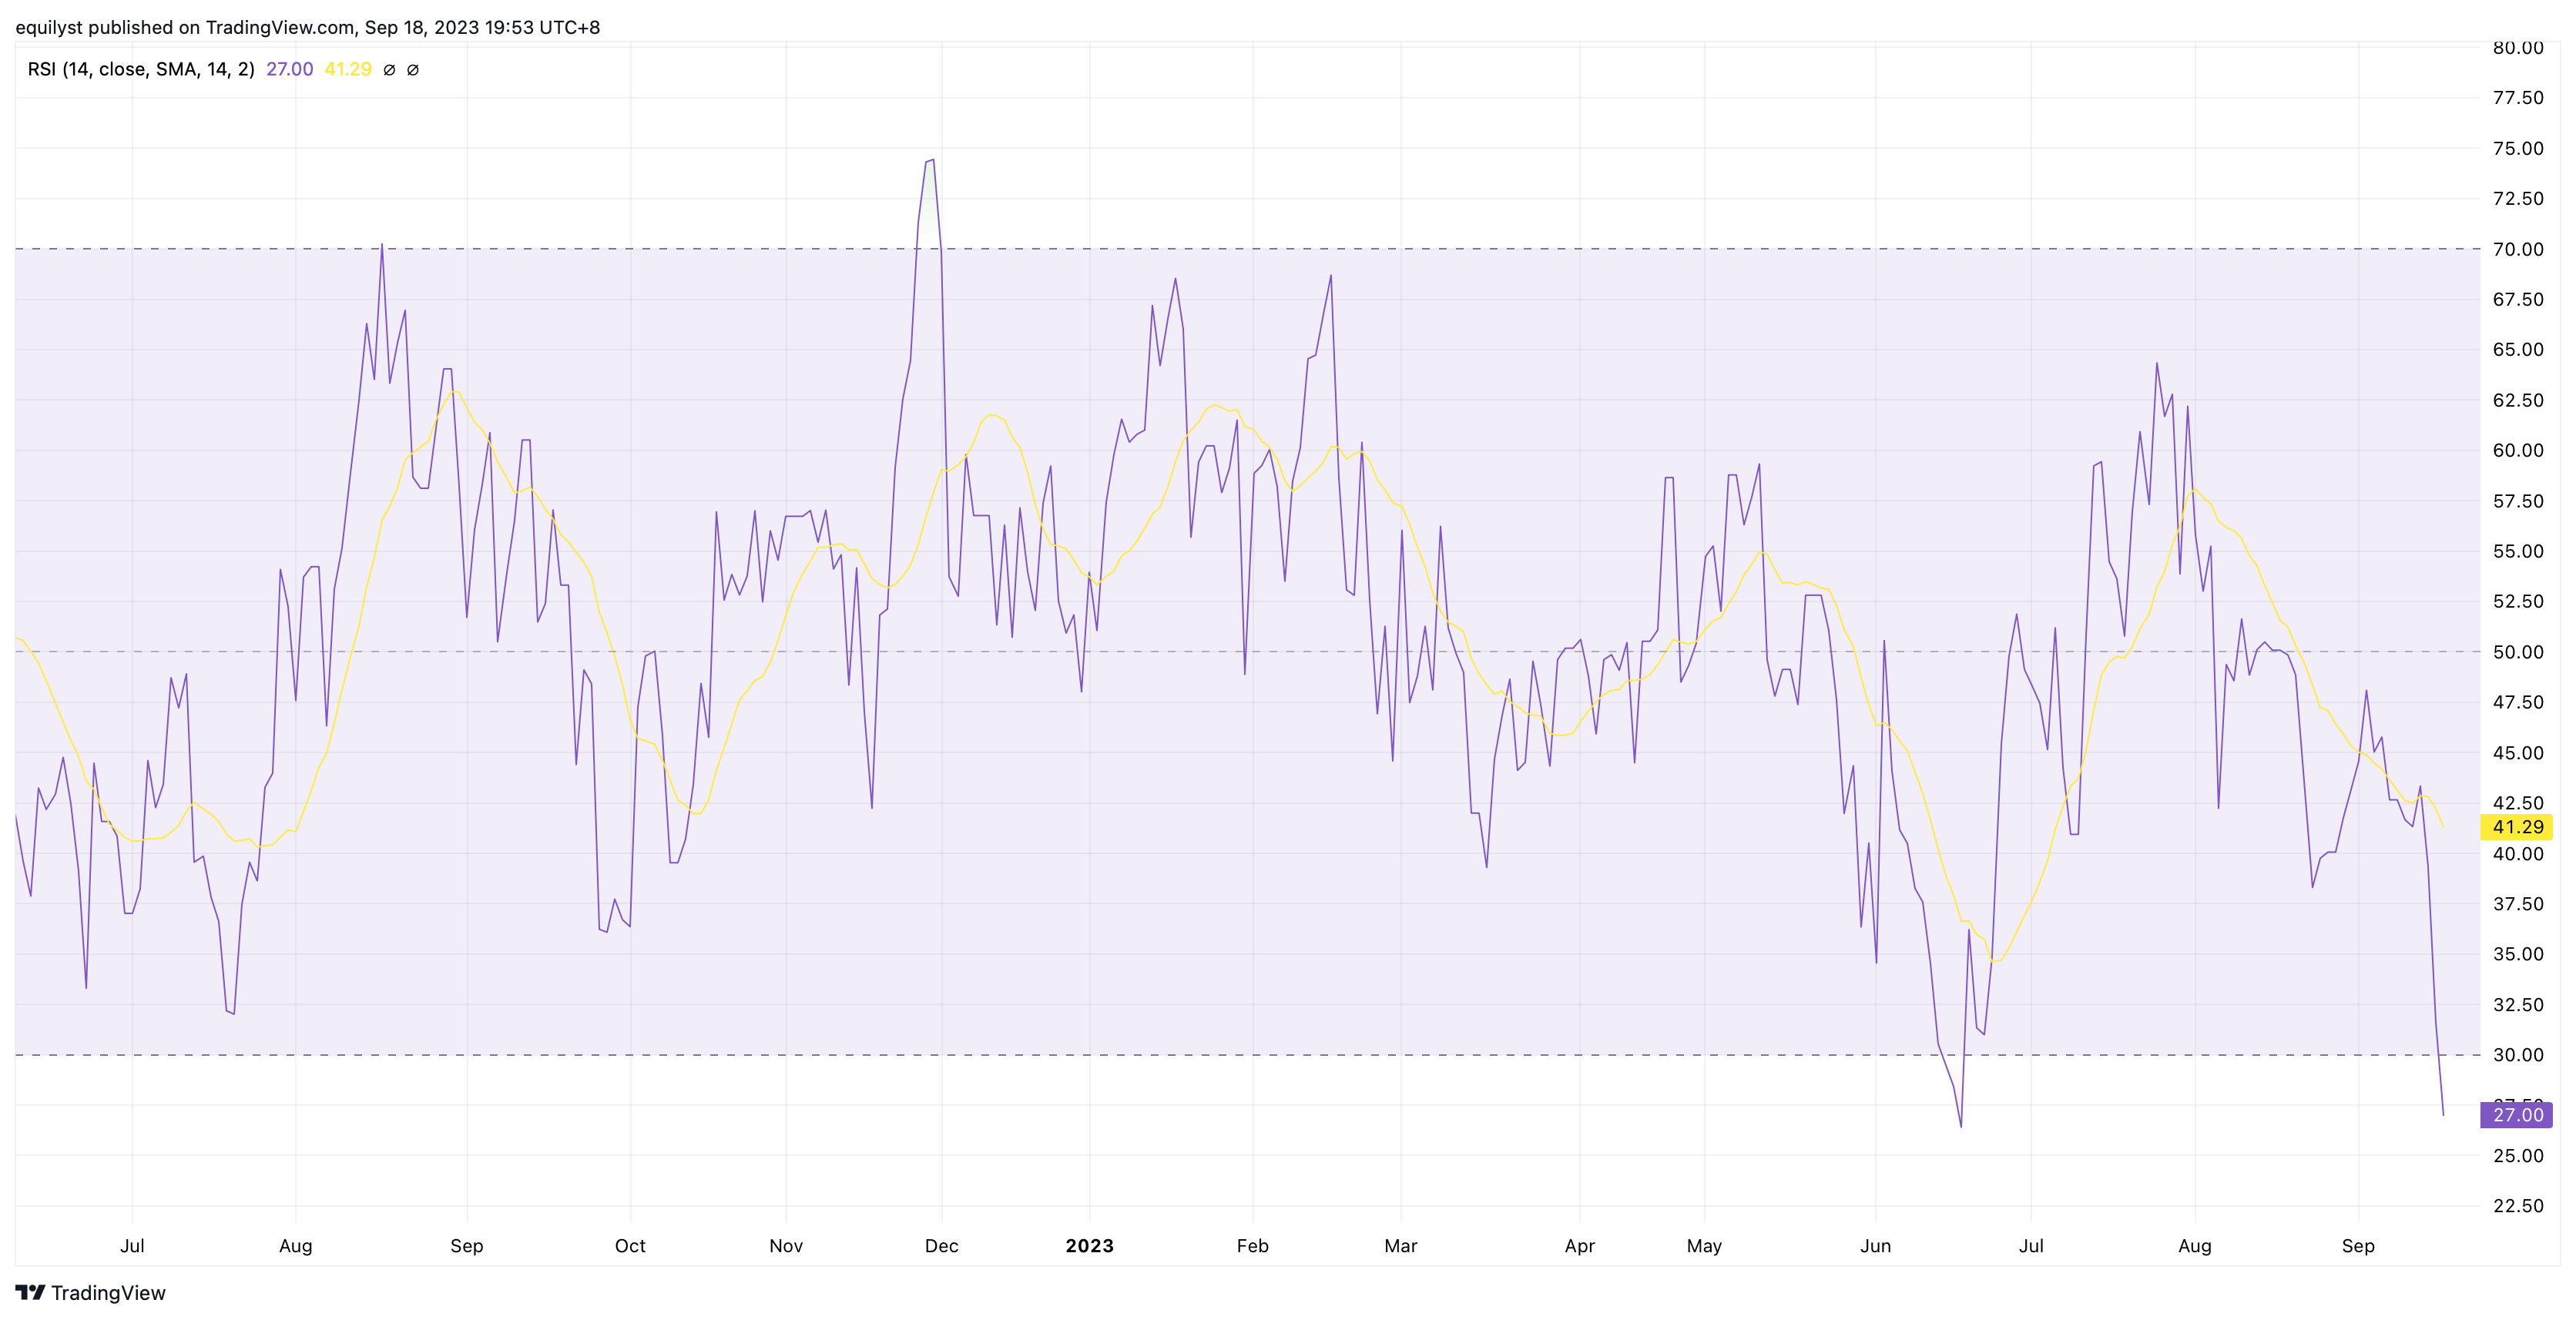
Metropolitan Bank & Trust Company (MBT): RSI – 27.00 (oversold)
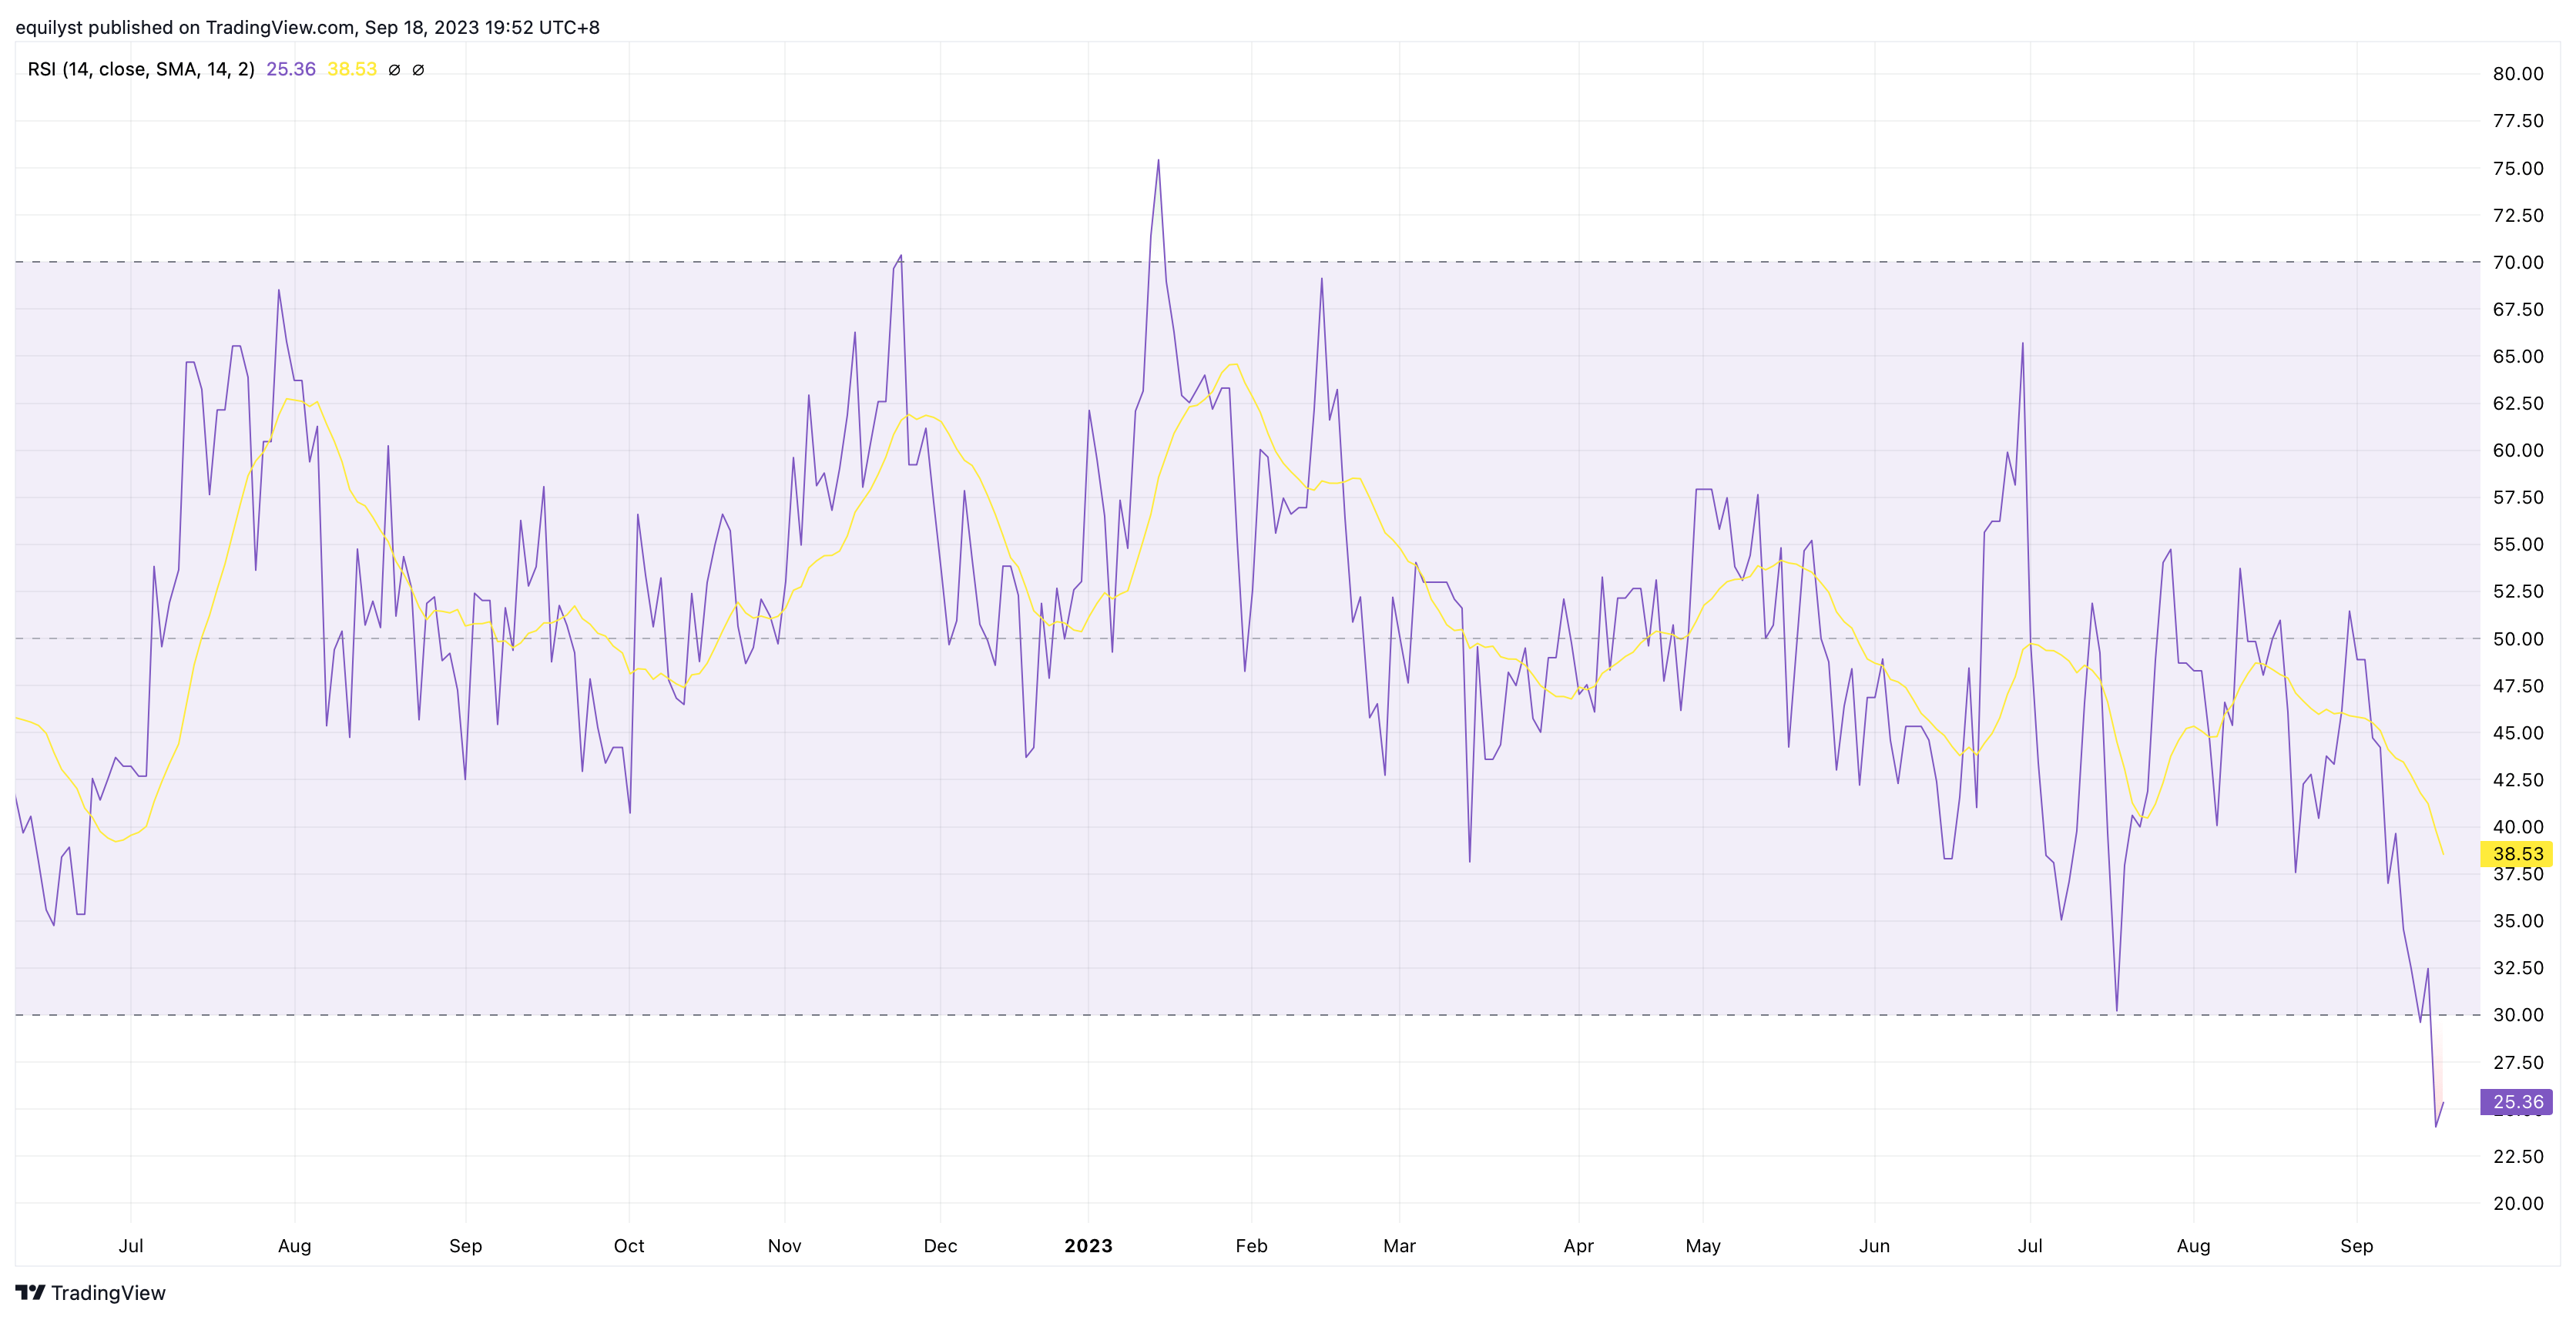
Aboitiz Power Corporation (AP): RSI – 25.36 (oversold)
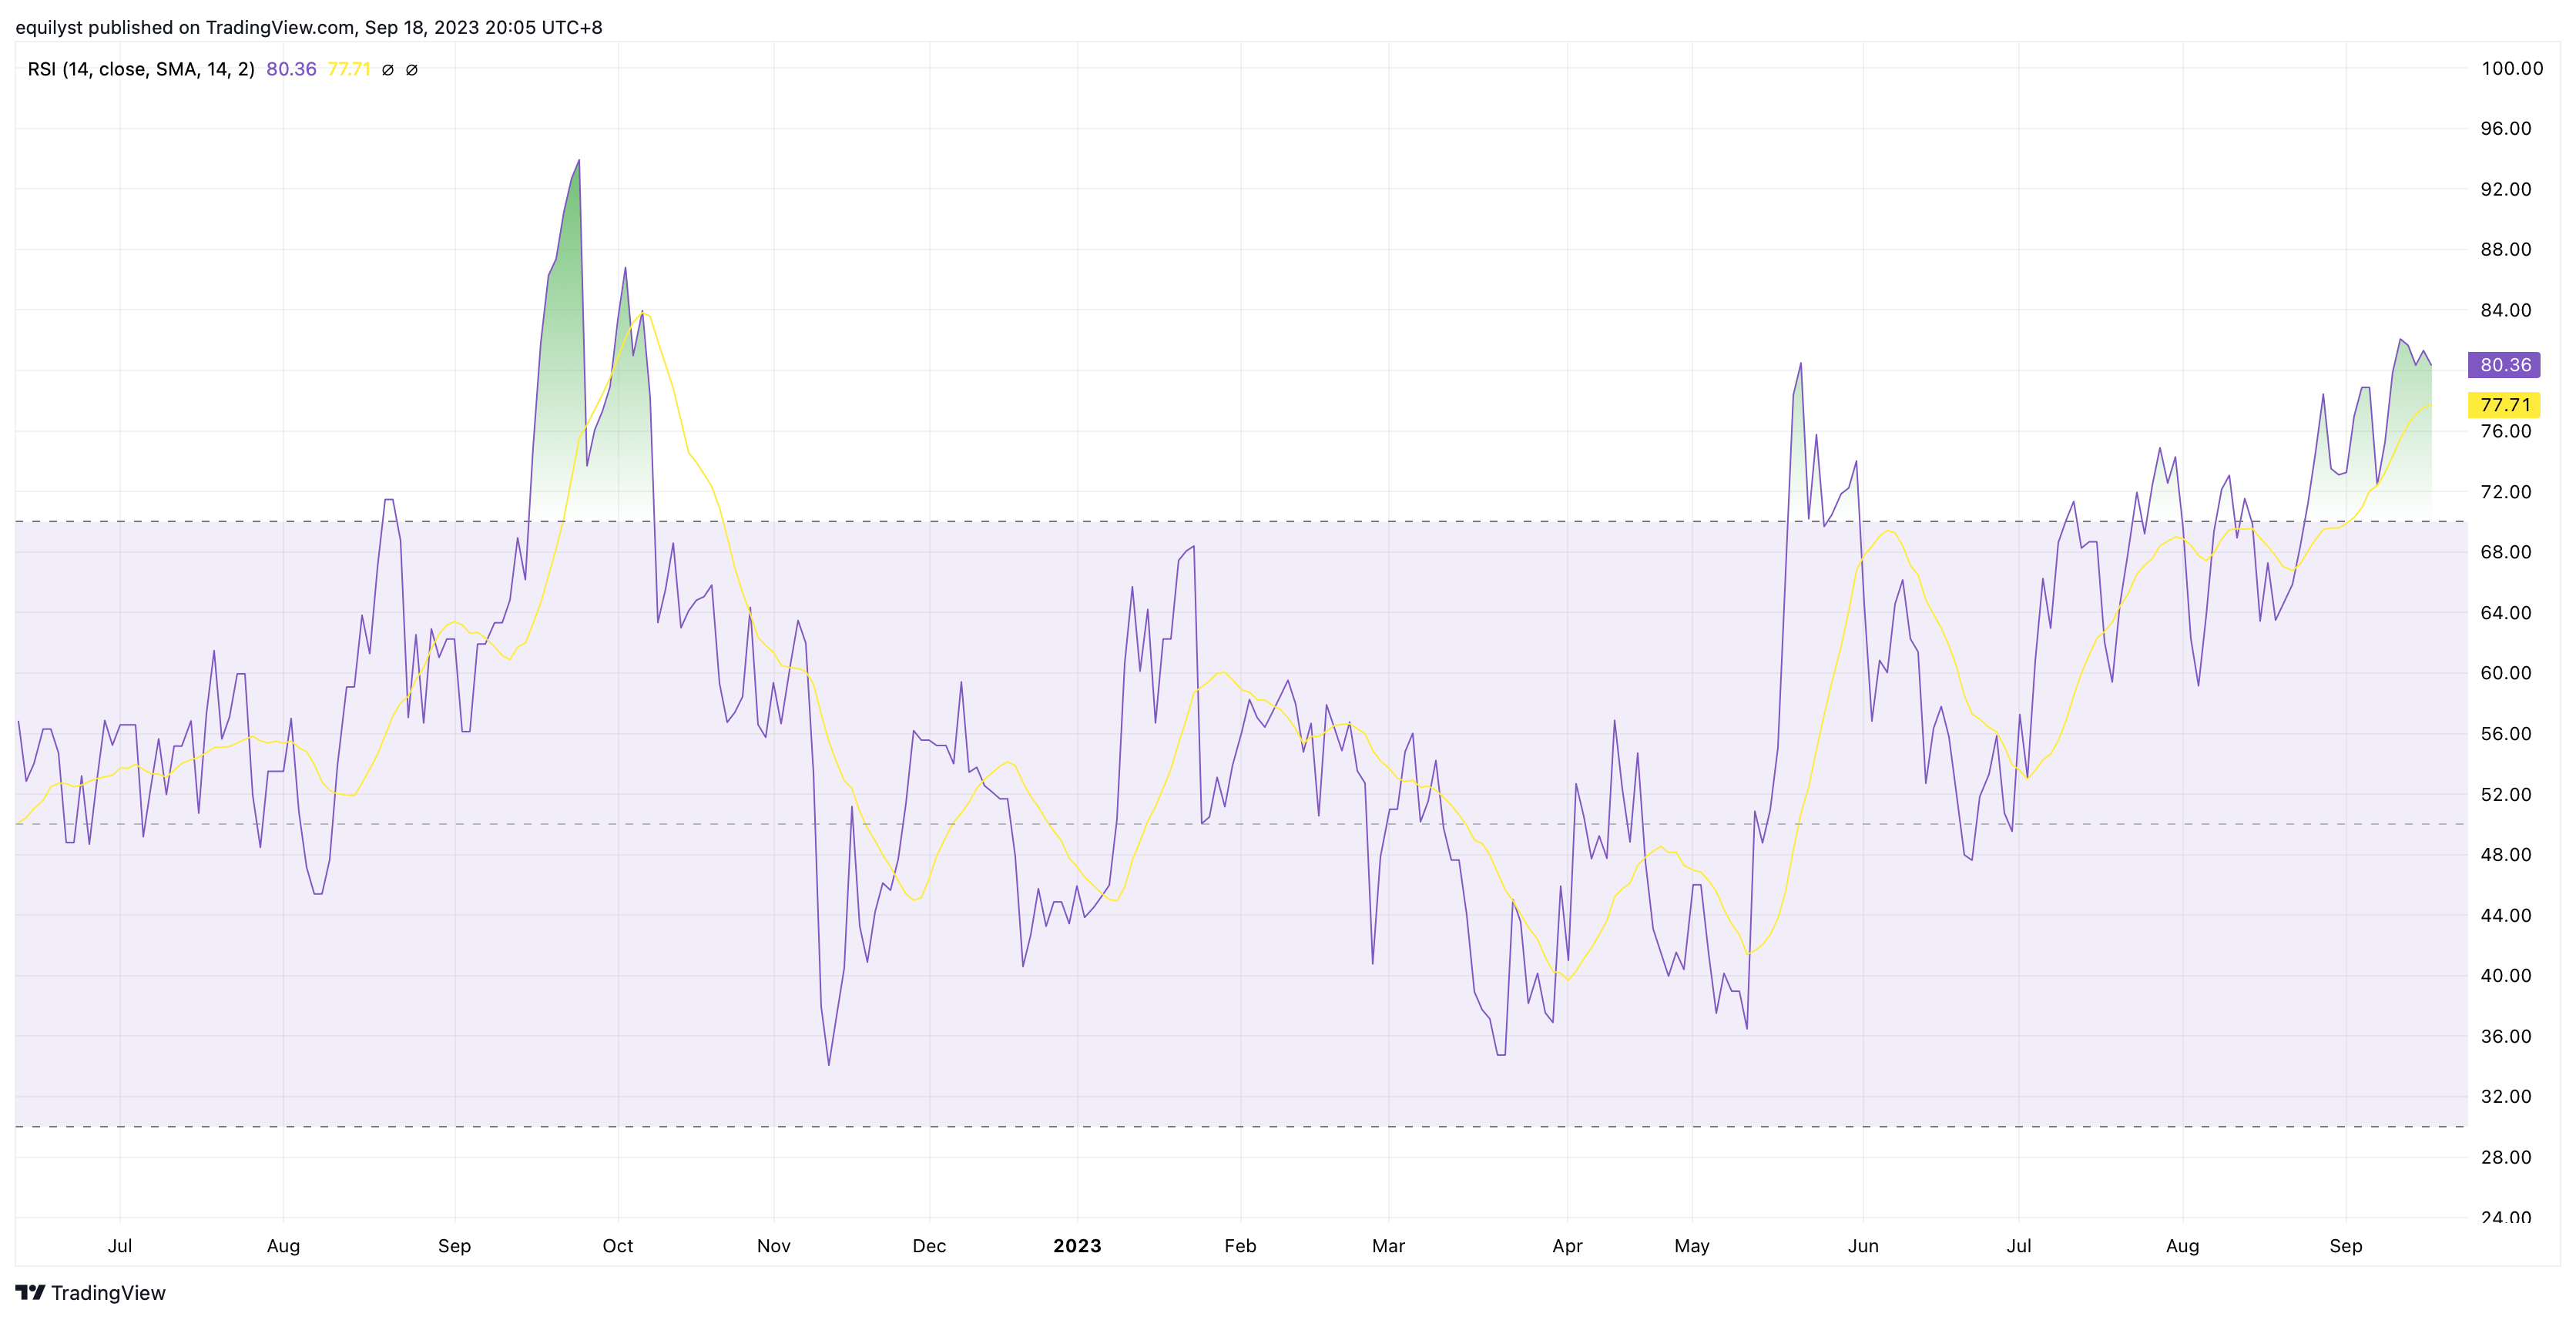
DigiPlus Interactive Corp. (PLUS): RSI – 80.36 (overbought)
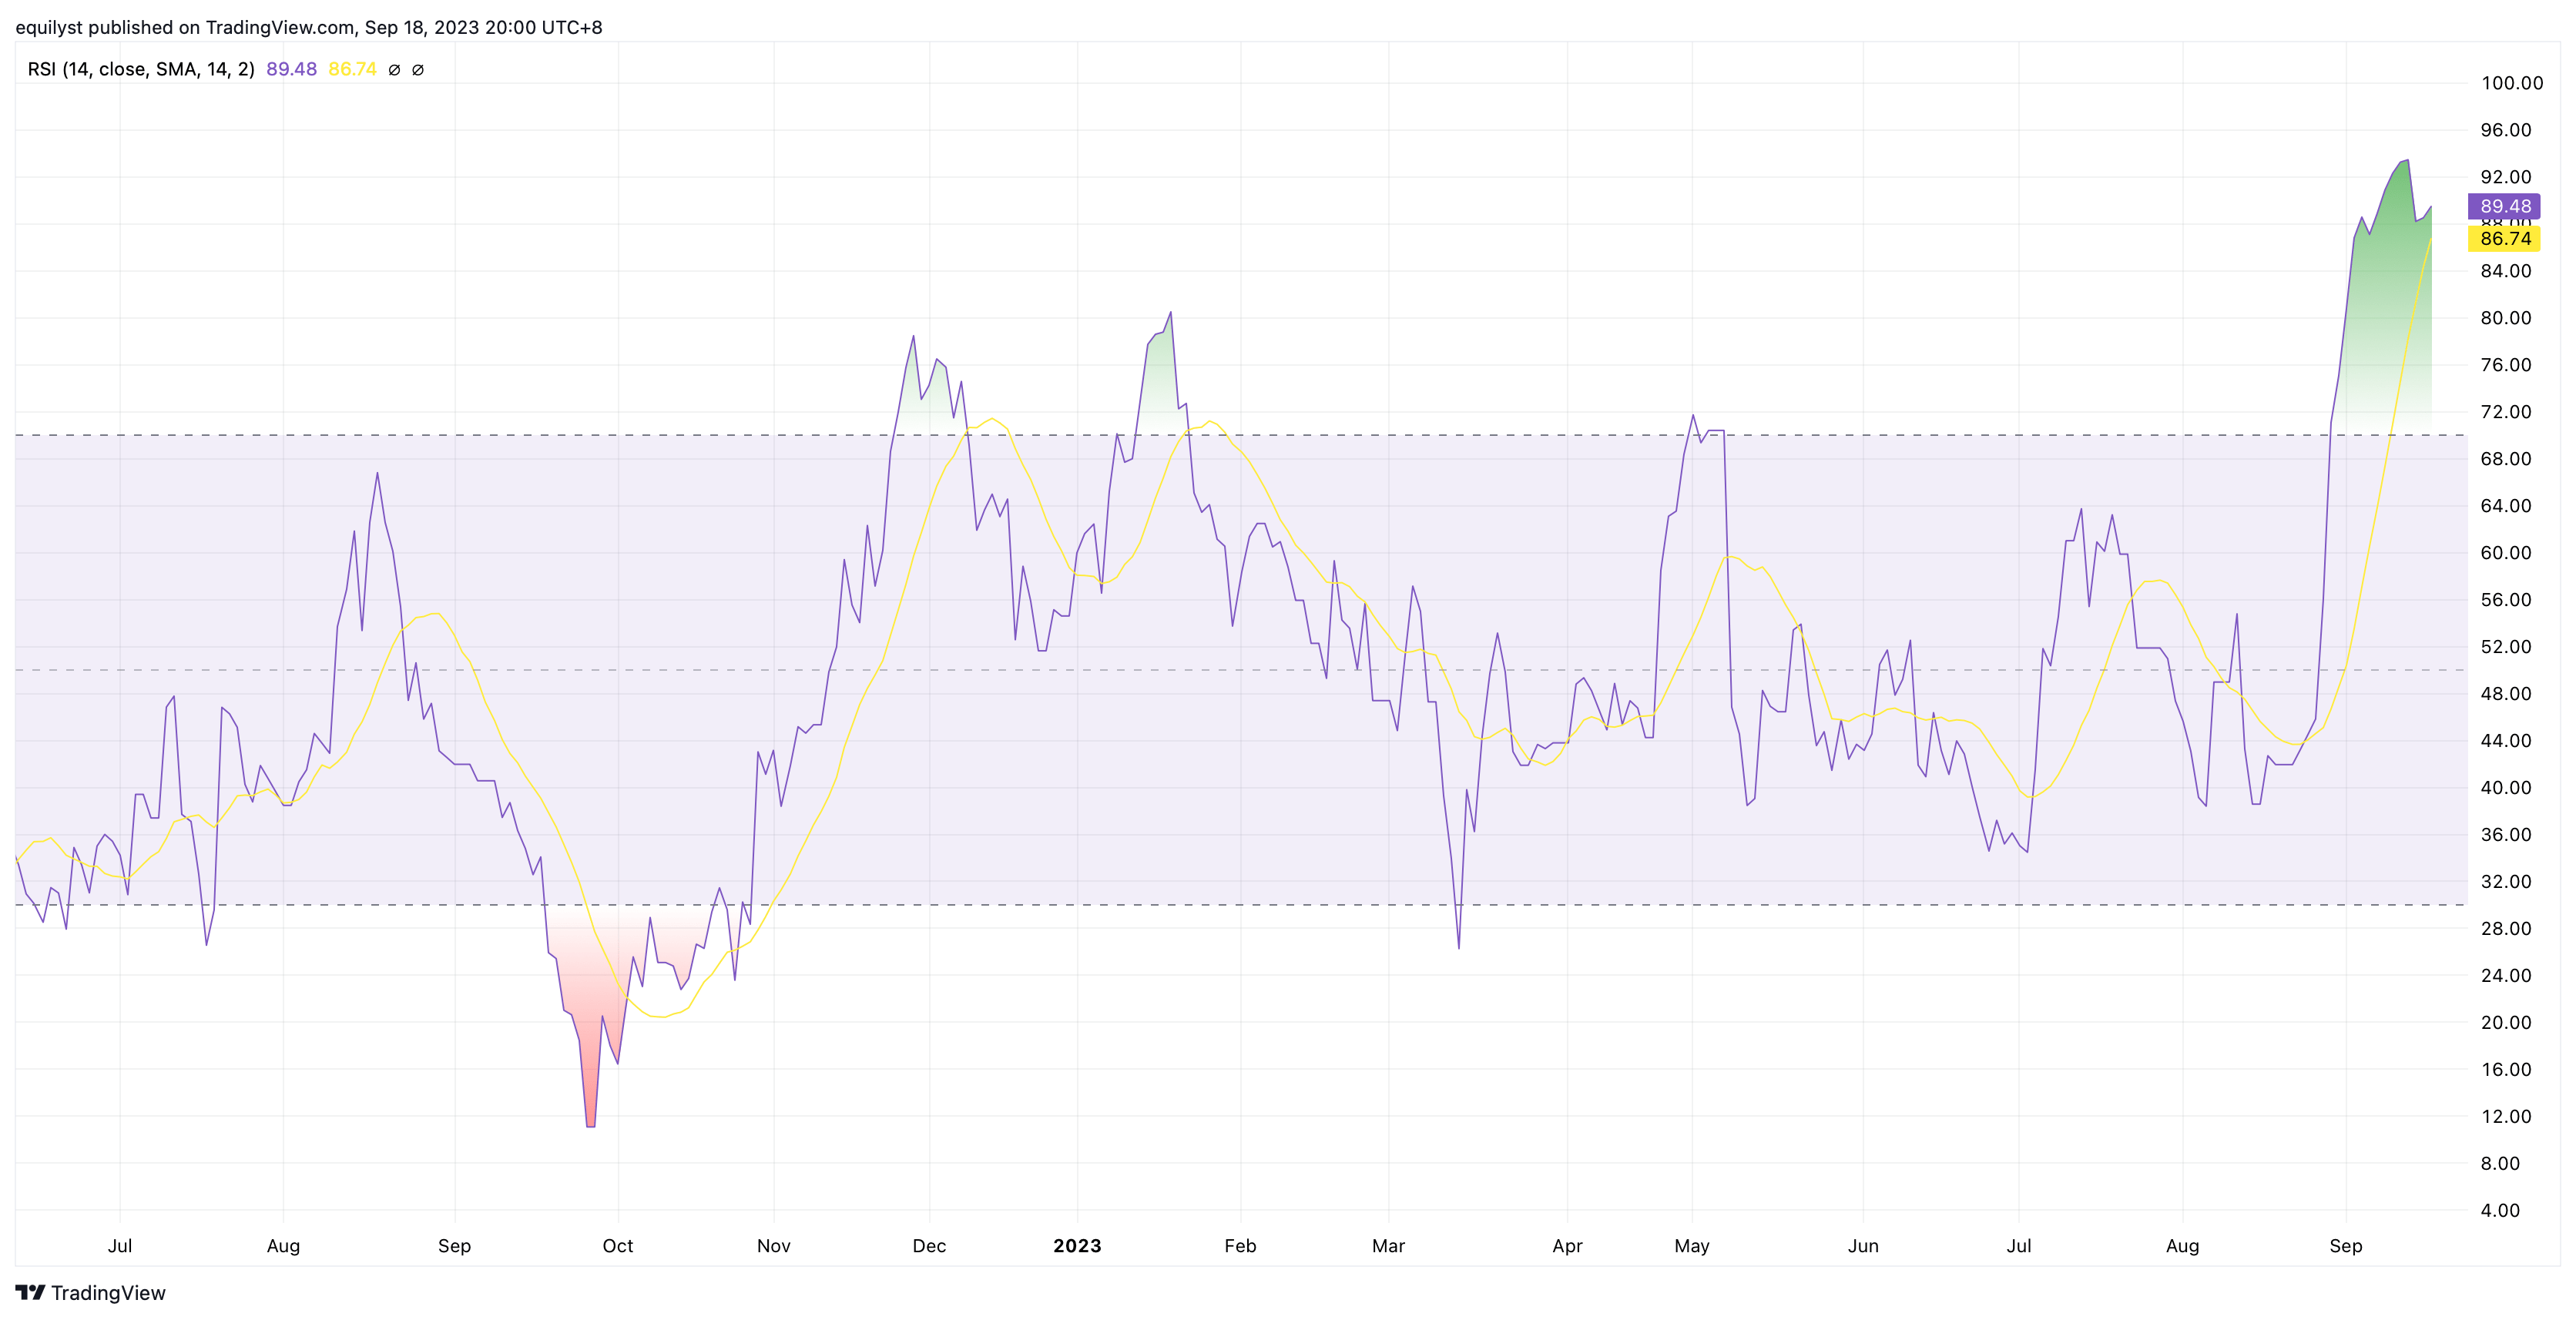
East West Banking Corporation (EW): RSI – 89.48 (overbought)
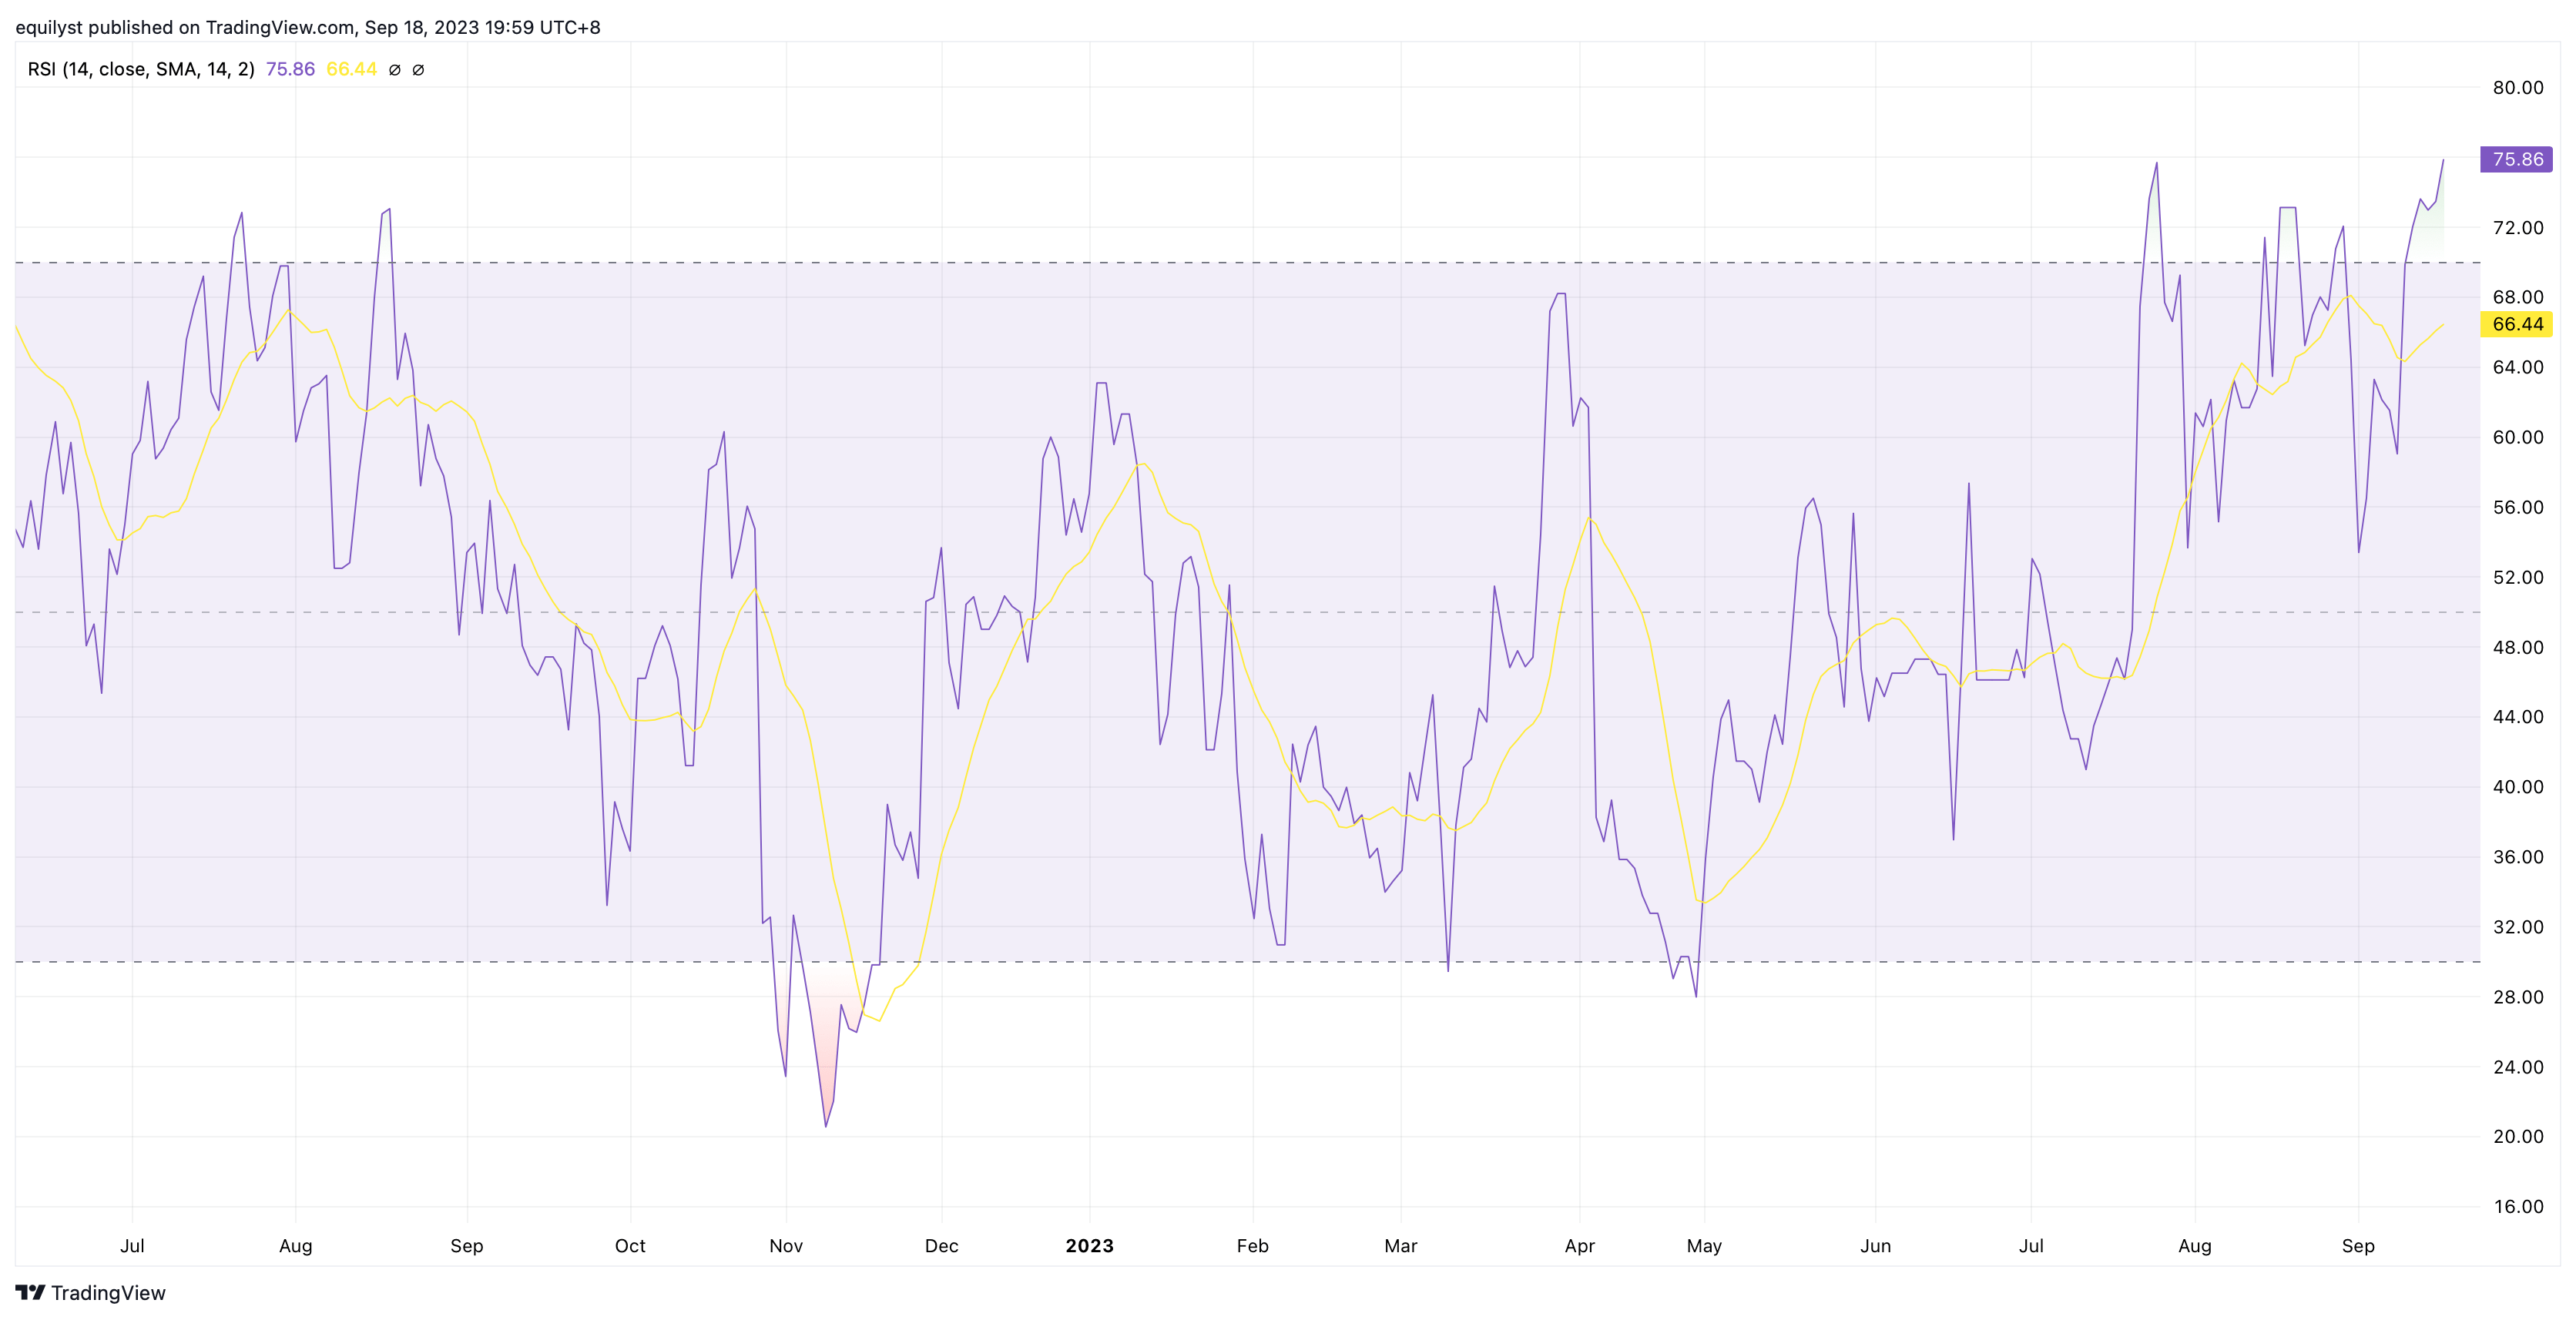
Semirara Mining and Power Corporation (SCC): RSI – 75.86 (overbought)
Wrapping It Up
The Relative Strength Index (RSI) is a valuable tool for identifying oversold and overbought conditions in the stock market. It helps traders recognize potential entry and exit points by gauging the strength and momentum of price movements. However, RSI should be used in conjunction with other analysis methods and not in isolation. Understanding the concept of oversold and overbought conditions through RSI can be a significant advantage for traders looking to make informed investment decisions.
Are you looking to hire a crypto or stock investment consultant? Complete this form to avail yourself of my crypto and stock market consulting service.
Are you looking to hire a content writer for your crypto and stock investment website? Here’s the form you need to fill out.
- MA, BDO, ALI, URC, PX: Is Their Dominant Range Pointing to a Breakout? - March 14, 2025
- Tracking Market Sentiment: MTD Ratings for 30 Bluechip Stocks (March 2025) - March 13, 2025
- PSEi Stalls Below 6,260 as Market Awaits Political Shift - March 12, 2025


