What Is the Directional Movement Index For?
The Directional Movement Index (DMI) is a popular technical analysis indicator used by traders and investors to assess the strength and direction of a trend in stock prices. The DMI consists of two lines: the Positive Directional Index (+DI) and the Negative Directional Index (-DI). These lines help traders identify potential buying and selling opportunities in the stock market.
Here’s how you can use the Directional Movement Index in decision-making for stocks:
1. Understanding the DMI Components:
- +DI (Positive Directional Index): Measures the strength of upward price movement.
- -DI (Negative Directional Index): Measures the strength of downward price movement.
- ADX (Average Directional Index): Represents the overall strength of the trend, whether it’s an uptrend or downtrend.
2. Interpreting DMI Signals:
- When +DI is above -DI: Indicates that the bulls have the upper hand, suggesting a potential uptrend.
- When -DI is above +DI: Indicates that the bears have the upper hand, suggesting a potential downtrend.
3. Using ADX for Trend Strength:
- ADX above 25: Indicates a strong trend, whether it’s up or down. Traders might consider entering a trade in the direction of the trend.
- ADX below 20: Suggests a weak trend, and it might not be an ideal time to enter a new trade based on DMI signals alone.
4. Trading Strategies with DMI:
- DMI Crossovers: A common strategy involves buying when +DI crosses above -DI and selling when -DI crosses above +DI. This suggests a potential shift in the trend direction.
- Trend Confirmation: DMI can be used to confirm existing trends. For example, in an uptrend, if +DI is above -DI and ADX is strong, it reinforces the bullish trend.
5. Risk Management:
- Stop Loss: Always use a stop loss to limit potential losses in case the market moves against your trade.
- Confirmation with Other Indicators: Consider using DMI in conjunction with other technical indicators or chart patterns for more robust trading decisions.
6. Continuous Monitoring:
- Regularly Monitor DMI: Stock market conditions change, so regularly monitor DMI and adjust your strategies accordingly.
7. Paper Trading:
- Practice with Paper Trading: If you are new to DMI, practice your strategies in a simulated trading environment (paper trading) to see how well they work before risking real money.
Remember that while DMI can be a valuable tool, no indicator is foolproof. It’s crucial to combine DMI with other forms of analysis and to consider the overall market context before making trading decisions. Additionally, past price movements are not indicative of future price movements, so always be cautious and make informed decisions.
Examples
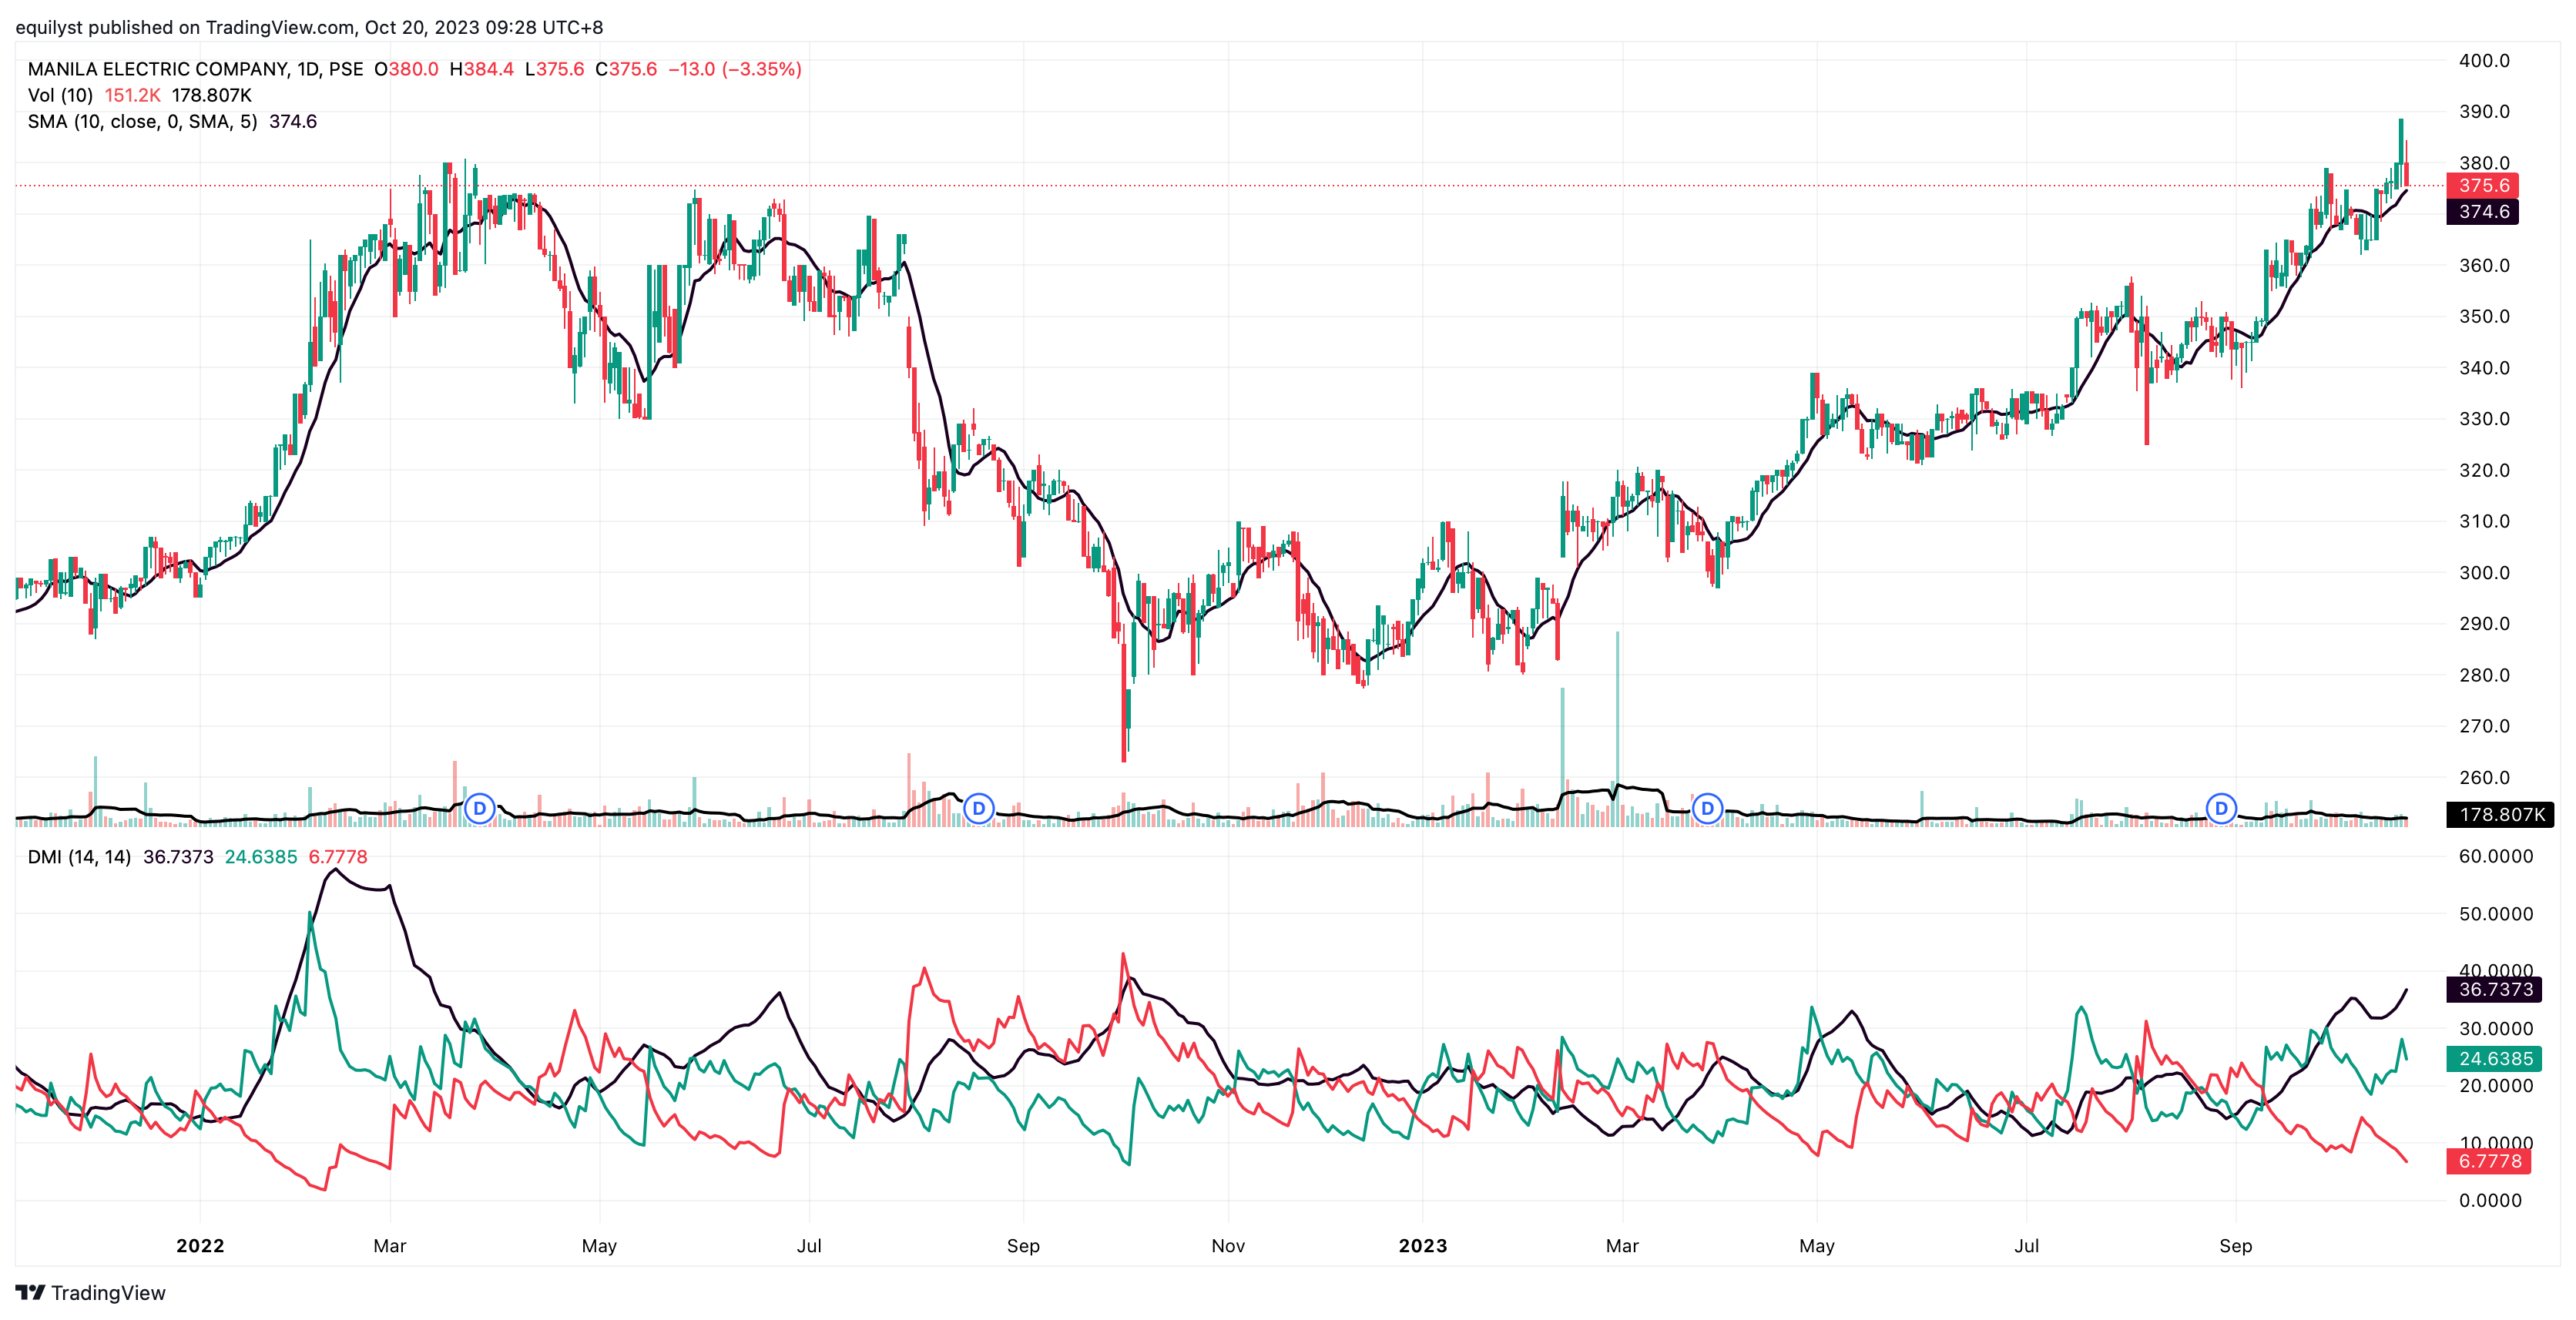
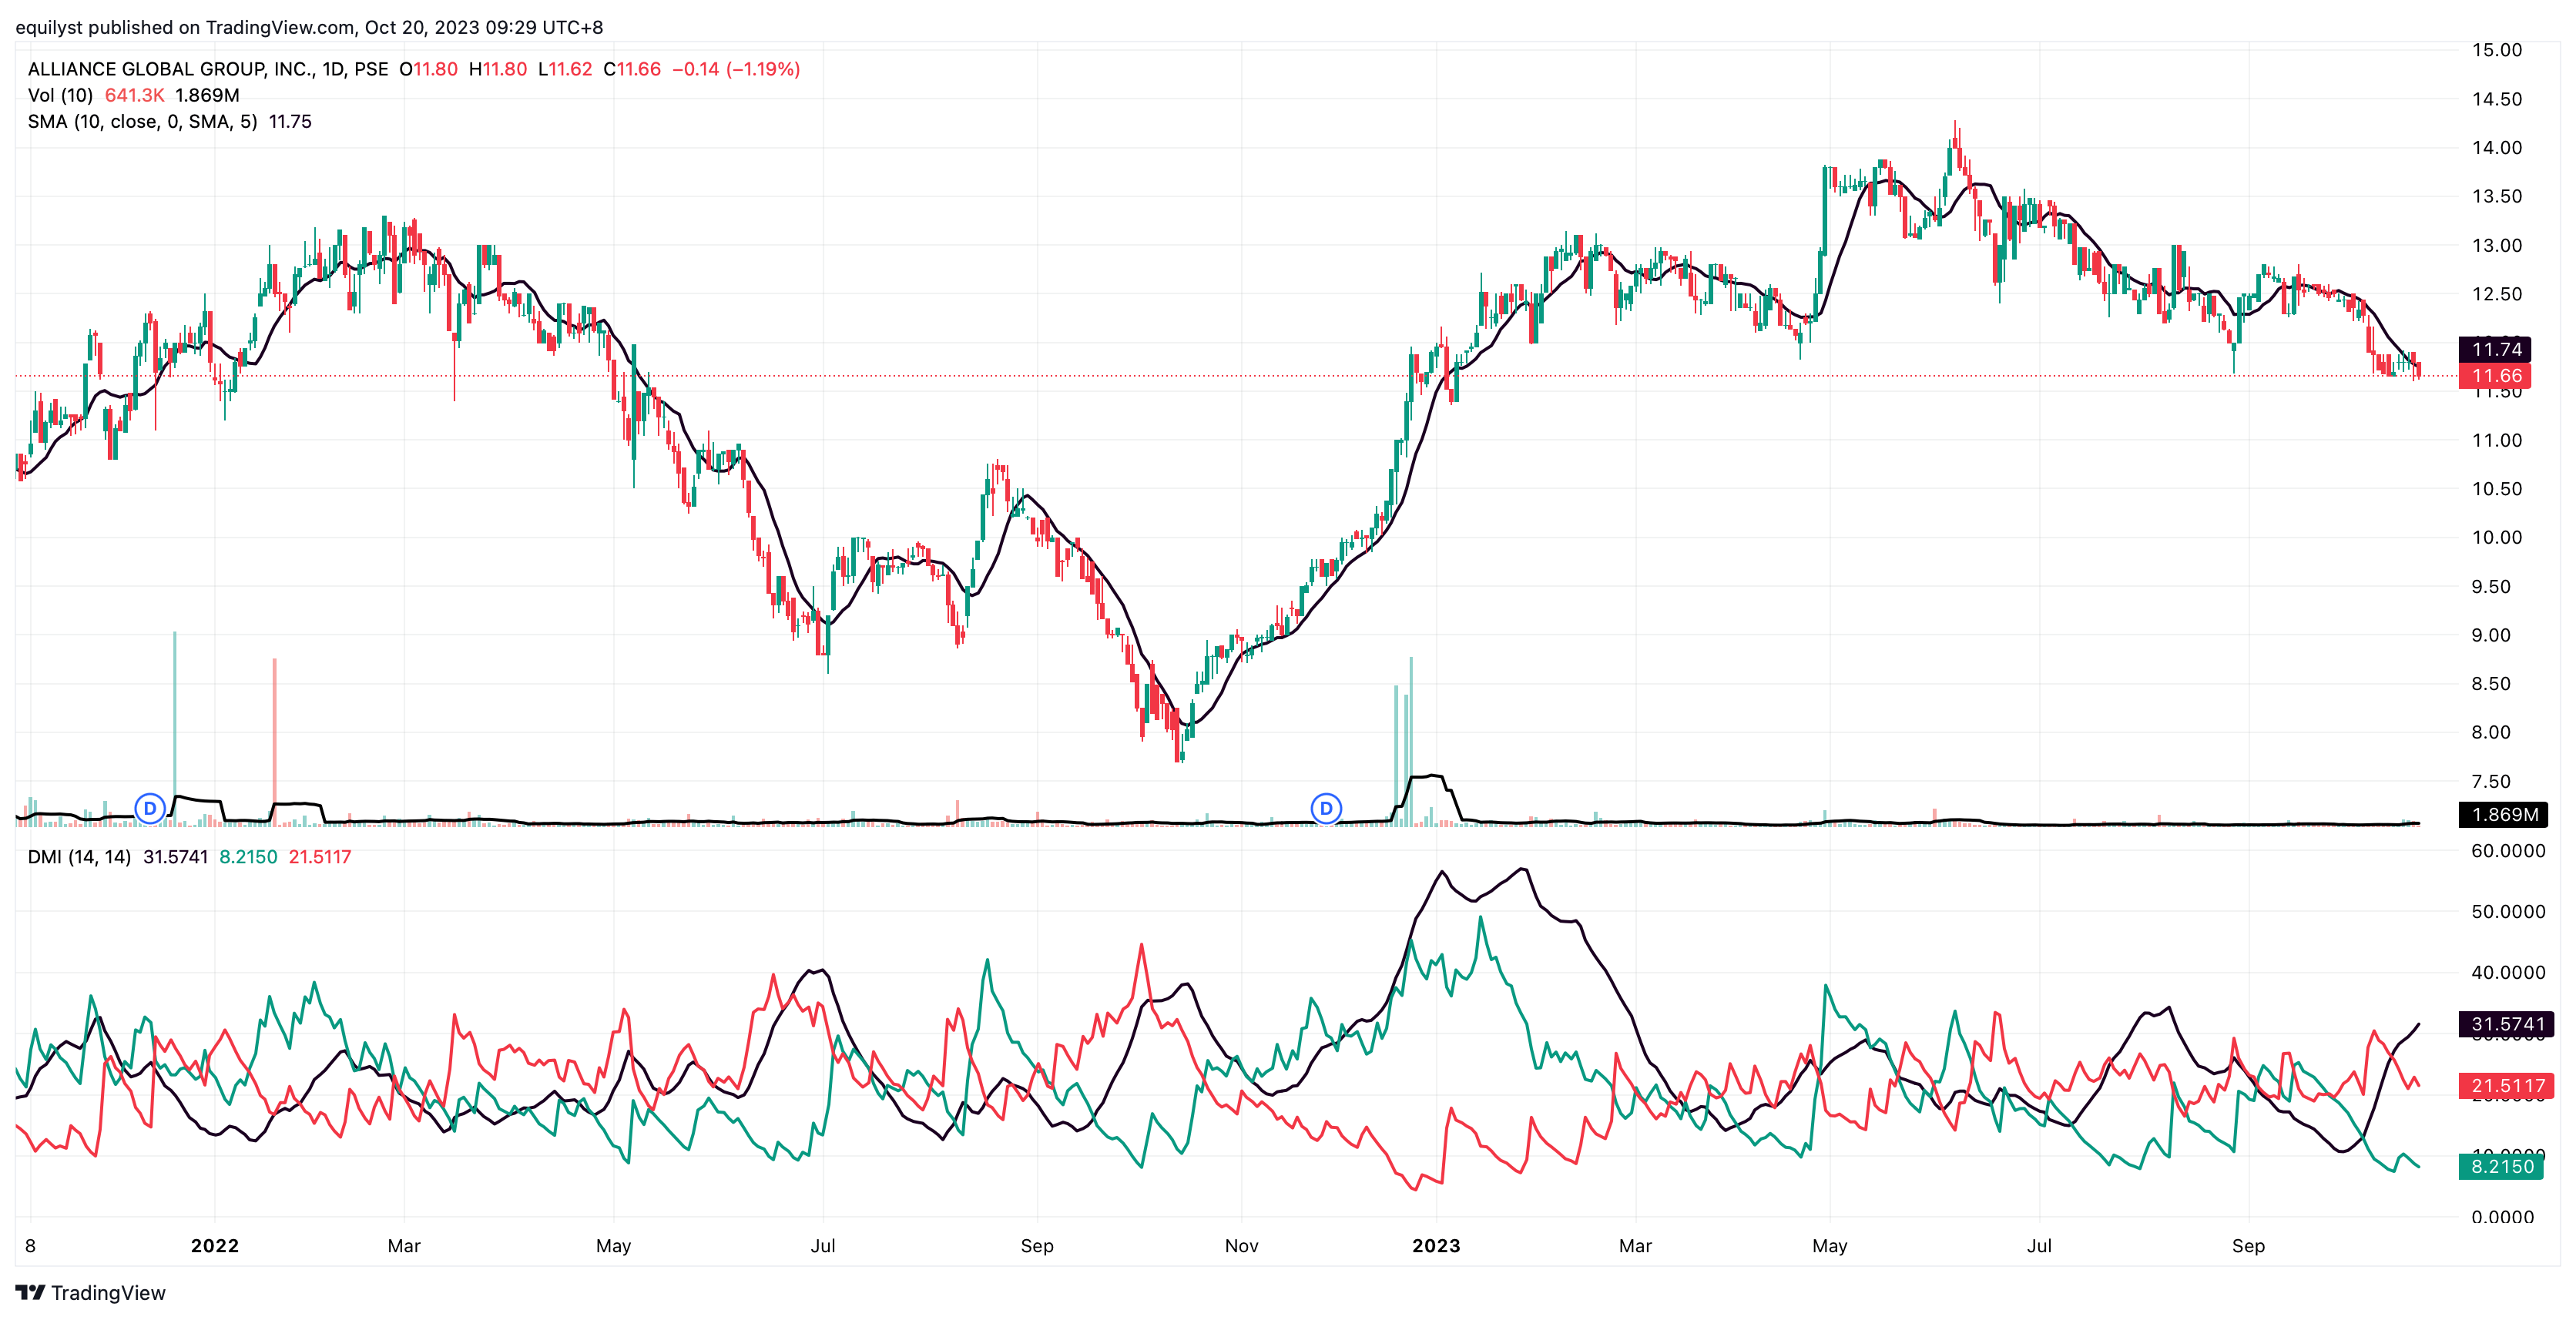
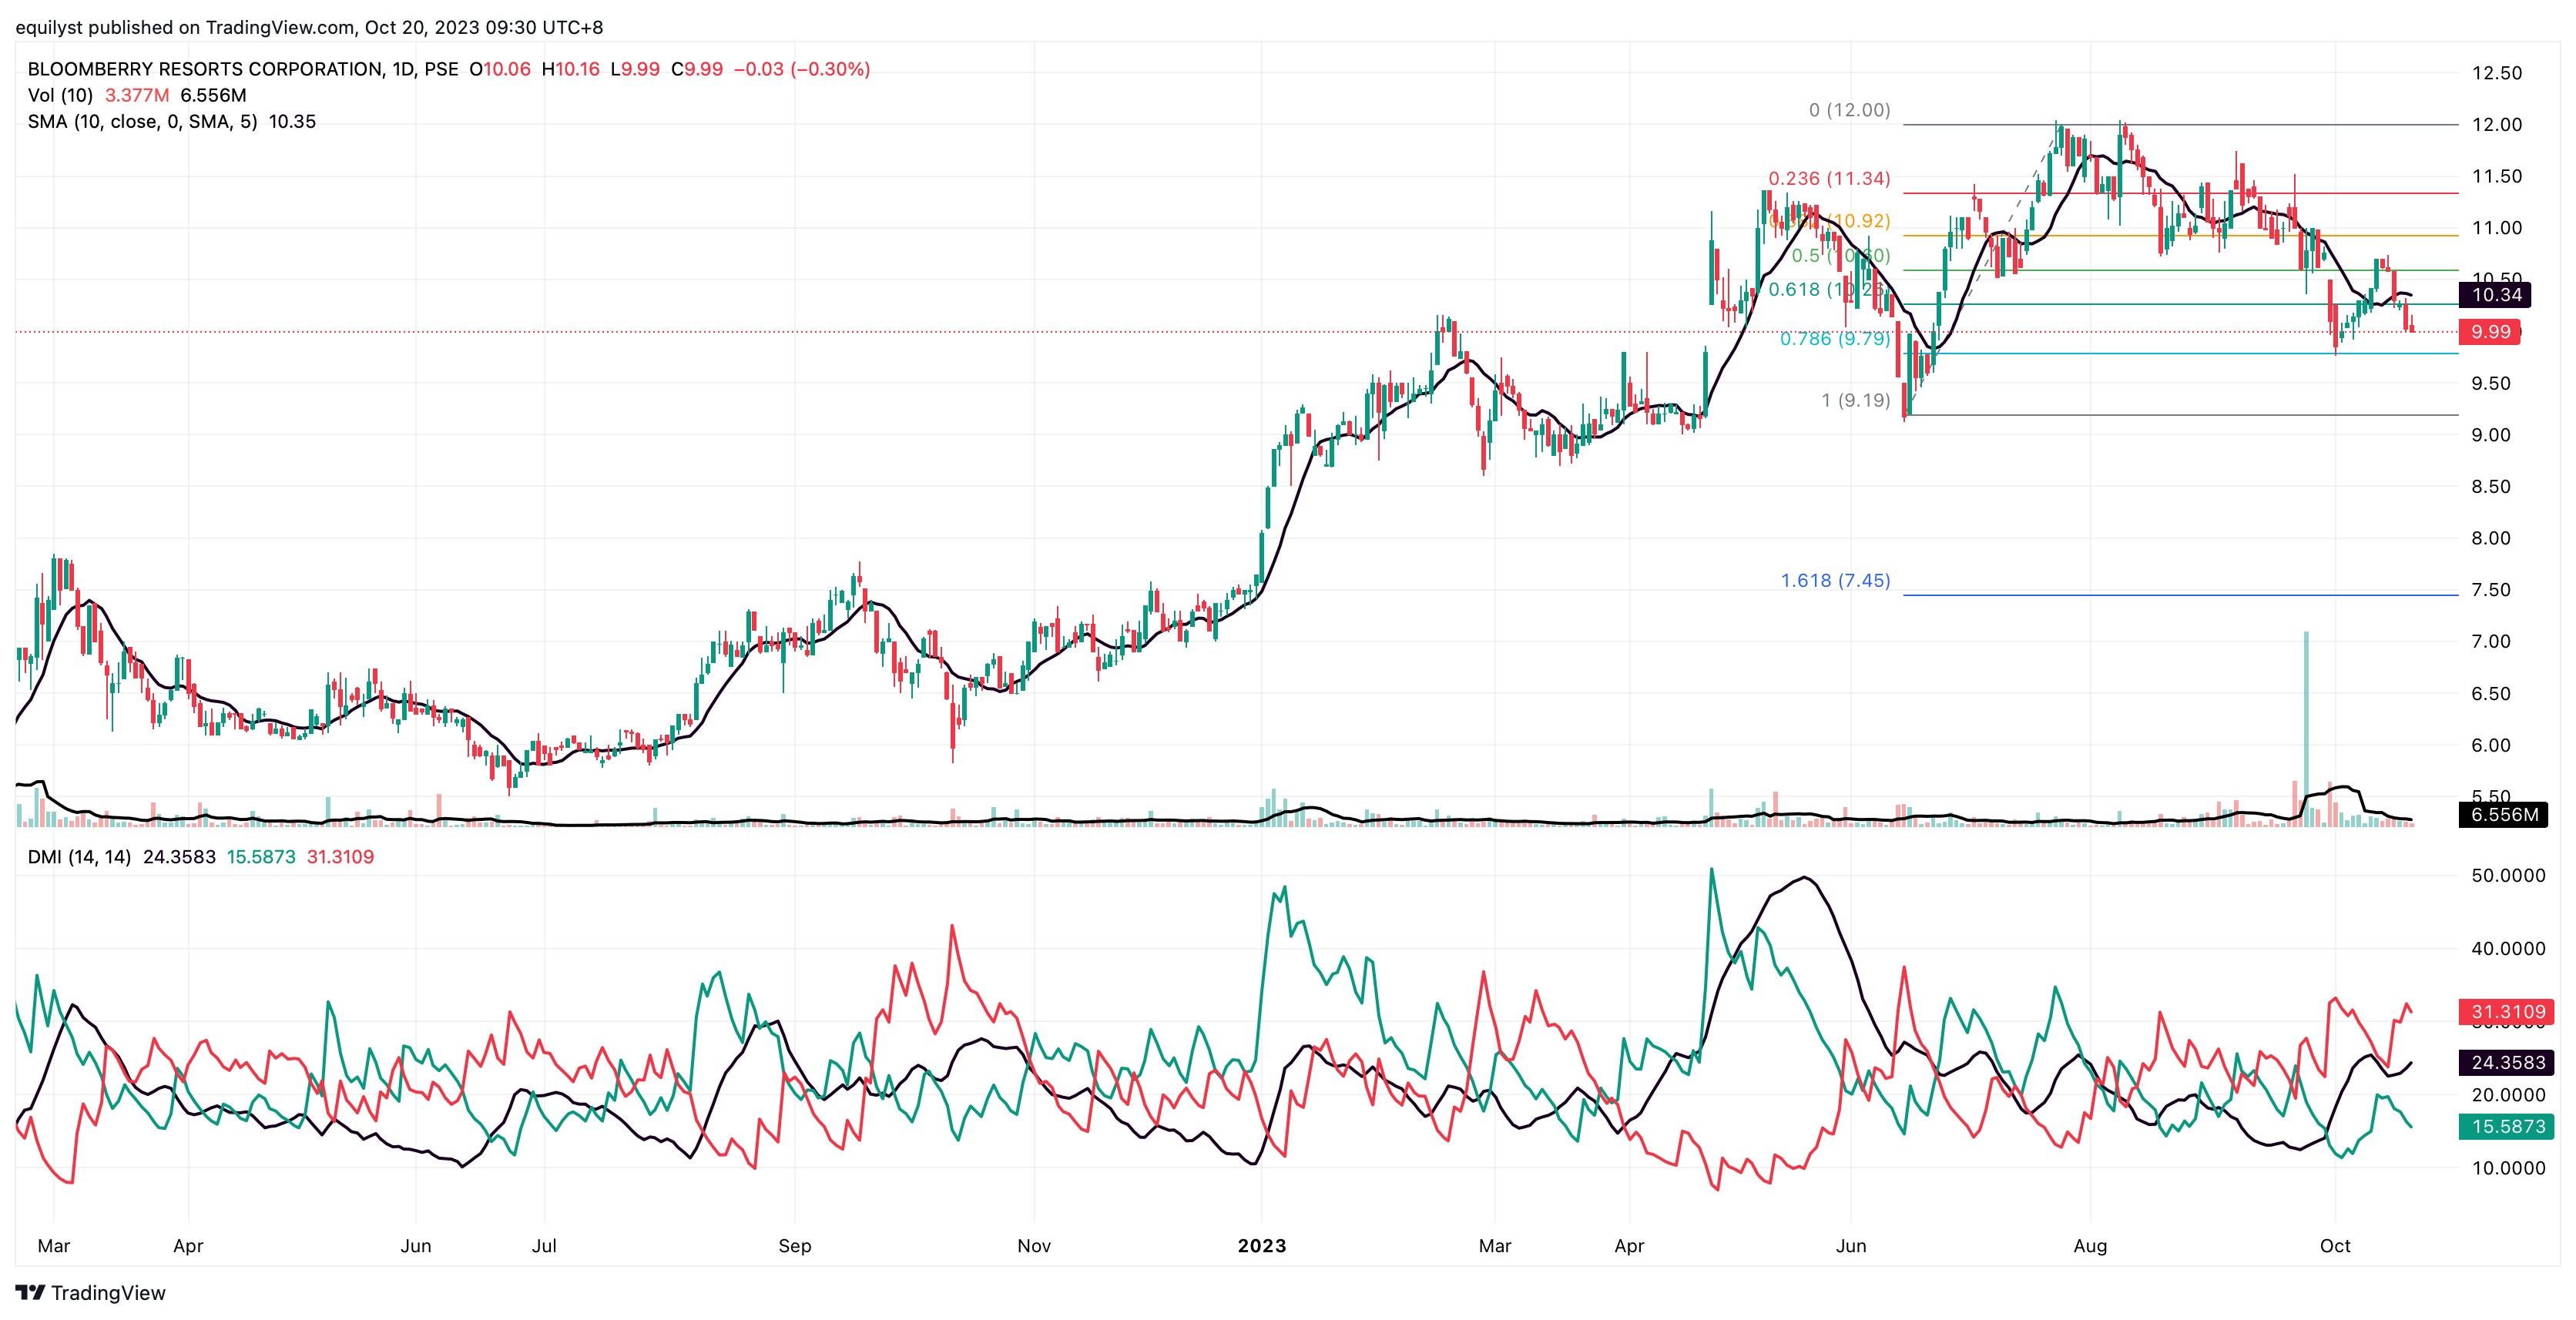
I’ll give you three samples. MER is an example of a stock with a STRONG UPTREND, AGI for a STRONG DOWNTREND, and BLOOM for a WEAK OR NO SIGNIFICANT TREND. I am not going to list down the numbers because you can see on the charts their ADX, +DMI, and -DMI scores.
Stock: MER
The ADX is trending above the +DMI. The +DMI hovers the -DMI.
Stock: AGI
The ADX is trending above the -DMI. The -DMI hovers the +DMI.
Stock: BLOOM
The ADX is between the +DMI and -DMI. The -DMI hovers the +DMI. It’s a weak trend, but bias is on the bears.
Here’s How I Can Help You Further
- hire me as your private stock investment consultant
- hire me as your crypto and stock investment content writer for your online stockbrokerage firm
- subscribe to my members-only stock analyses
- subscribe to my members-only stock screener so you’ll know which stocks I’m monitoring daily
- MA, BDO, ALI, URC, PX: Is Their Dominant Range Pointing to a Breakout? - March 14, 2025
- Tracking Market Sentiment: MTD Ratings for 30 Bluechip Stocks (March 2025) - March 13, 2025
- PSEi Stalls Below 6,260 as Market Awaits Political Shift - March 12, 2025


