What’s Price-to-Sales Ratio and the Ideal P/S?
The Price-to-Sales (P/S) ratio is a financial metric used to assess the valuation of a company’s stock in relation to its revenue. It’s calculated by dividing the market price per share of the company’s stock by its revenue per share. The formula is:
Price-to-Sales Ratio = Market Price per Share / Revenue per Share
In this ratio, the market price per share is the current trading price of one share of the company’s stock, and the revenue per share is the company’s total revenue divided by the total number of outstanding shares.
The Price-to-Sales ratio is often used as an alternative to the more common Price-to-Earnings (P/E) ratio, especially for companies that are not yet profitable or have unstable earnings. It’s particularly useful for evaluating companies in industries where earnings might not accurately reflect their potential or value, such as startups, technology firms, or companies undergoing rapid growth.
A low Price-to-Sales ratio can suggest that a company’s stock is undervalued relative to its revenue, indicating a potential investment opportunity. On the other hand, a high Price-to-Sales ratio might indicate that the stock is overvalued in relation to its revenue, which could imply that investors are paying a premium for each unit of sales generated.
However, it’s important to note that the Price-to-Sales ratio, like any single financial metric, should not be used in isolation. It’s best used in conjunction with other financial ratios and thorough analysis to make informed investment decisions. Additionally, the interpretation of Price-to-Sales ratios can vary across industries, so comparing the Price-to-Sales ratios of companies within the same industry is more meaningful than comparing them across different sectors.
9 Undervalued PSE Bluechips With Price-to-Sales Less Than One
Rank: 9
Stock Code: DMC
Price-to-Sales: 0.98
Rank: 8
Stock Code: JGS
Price-to-Sales: 0.91
Rank: 7
Stock Code: LTG
Price-to-Sales: 0.90
Rank: 6
Stock Code: MER
Price-to-Sales: 0.86
Rank: 5
Stock Code: AEV
Price-to-Sales: 0.80
Rank: 4
Stock Code: AGI
Price-to-Sales: 0.58
Rank: 3
Stock Code: GTCAP
Price-to-Sales: 0.49
Rank: 2
Stock Code: PGOLD
Price-to-Sales: 0.42
Rank: 1
Stock Code: SMC
Price-to-Sales: 0.17
Dominant Range of the 9 Undervalued PSE Bluechips with Price-to-Sales Ratio Less Than 1
The dominant price range is either a standalone price or a range of prices with the highest volume and the greatest number of trades.
Let me respond to that question with more questions.
Imagine you’re on the verge of buying the stock. If the dominant price range is closer to the intraday low than the intraday high, will you rush into buying, or will you wait a bit longer because the price is likely to continue moving downward?
Now, consider you’re about to realize your gains, even though your trailing stop is still in place. If the dominant price range is closer to the intraday high than the intraday low, will you rush into selling, or will you wait a bit longer because the price is likely to continue moving upward?
Picture this: it’s been 60 minutes since the opening bell. If the current price is at the intraday high itself, but the dominant price range includes the intraday low, wouldn’t that make you question the sustainability of the intraday bullishness?
I’ve only presented you with three scenarios where understanding the location of the dominant price range is useful in decision-making. There’s a lot more we can discuss in my stock investment consultancy service. Learn about the requirements here.
Here’s the dominant range of each of the nine undervalued PSE bluechips with price-to-sales ratio of less than one:
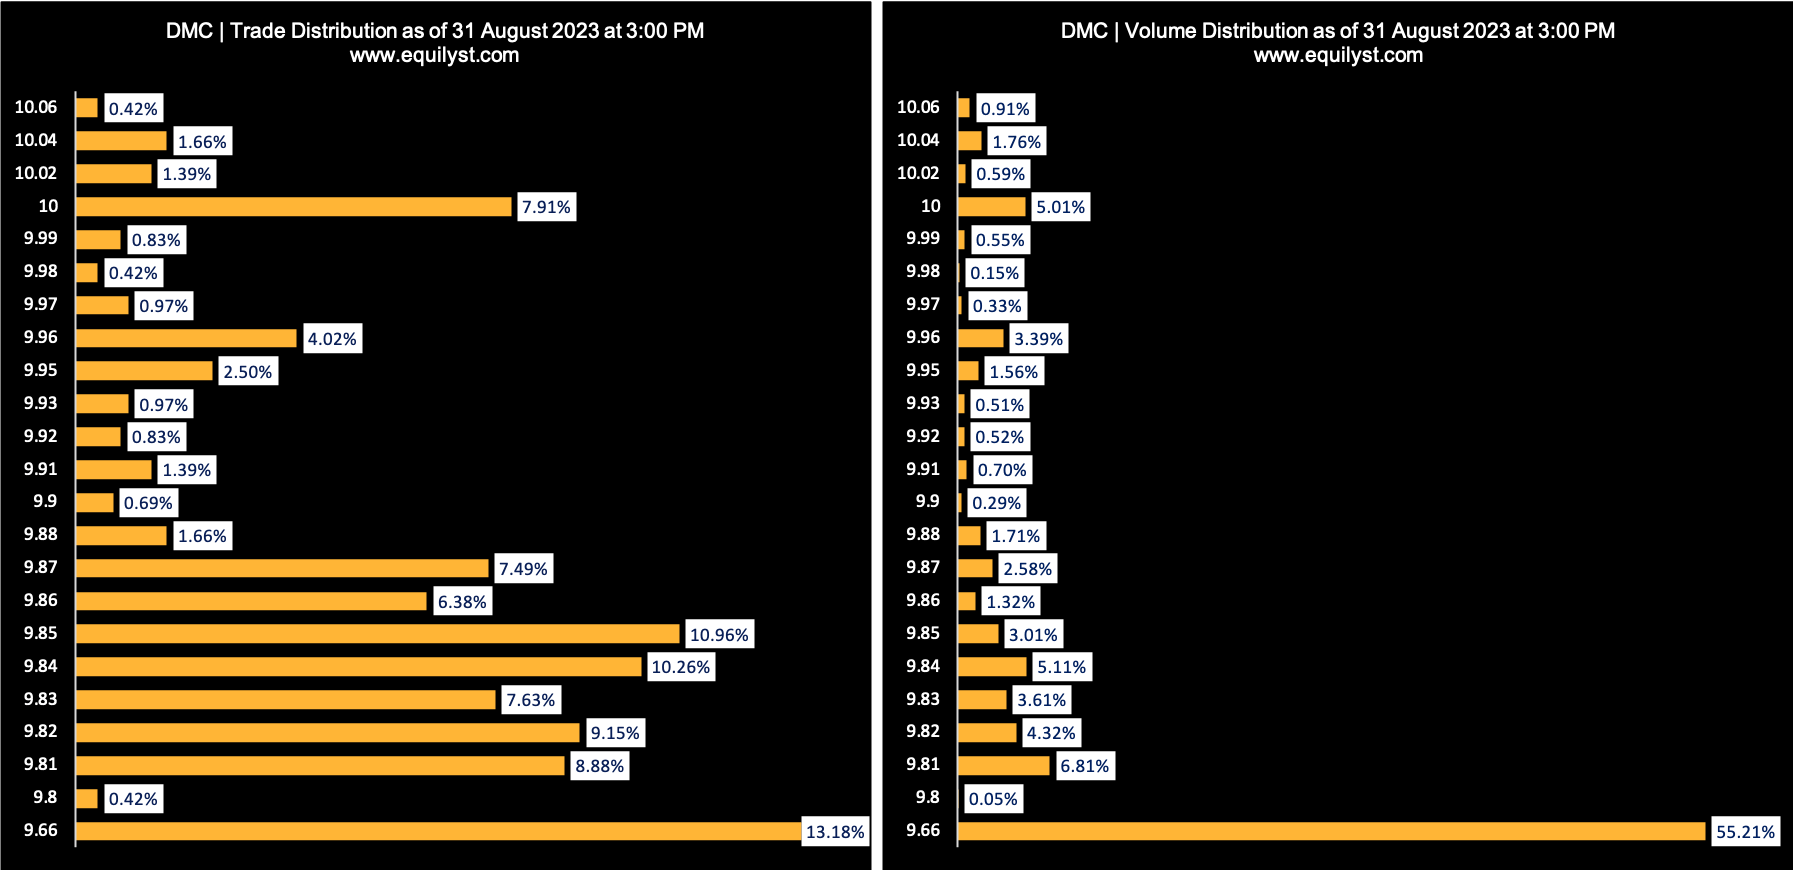
Rank: 9
Stock Code: DMC
Price-to-Sales: 0.98
Dominant Range Index: BEARISH
Last Price: 9.66
VWAP: 9.76
Dominant Range: 9.66 – 9.66
 Rank: 8
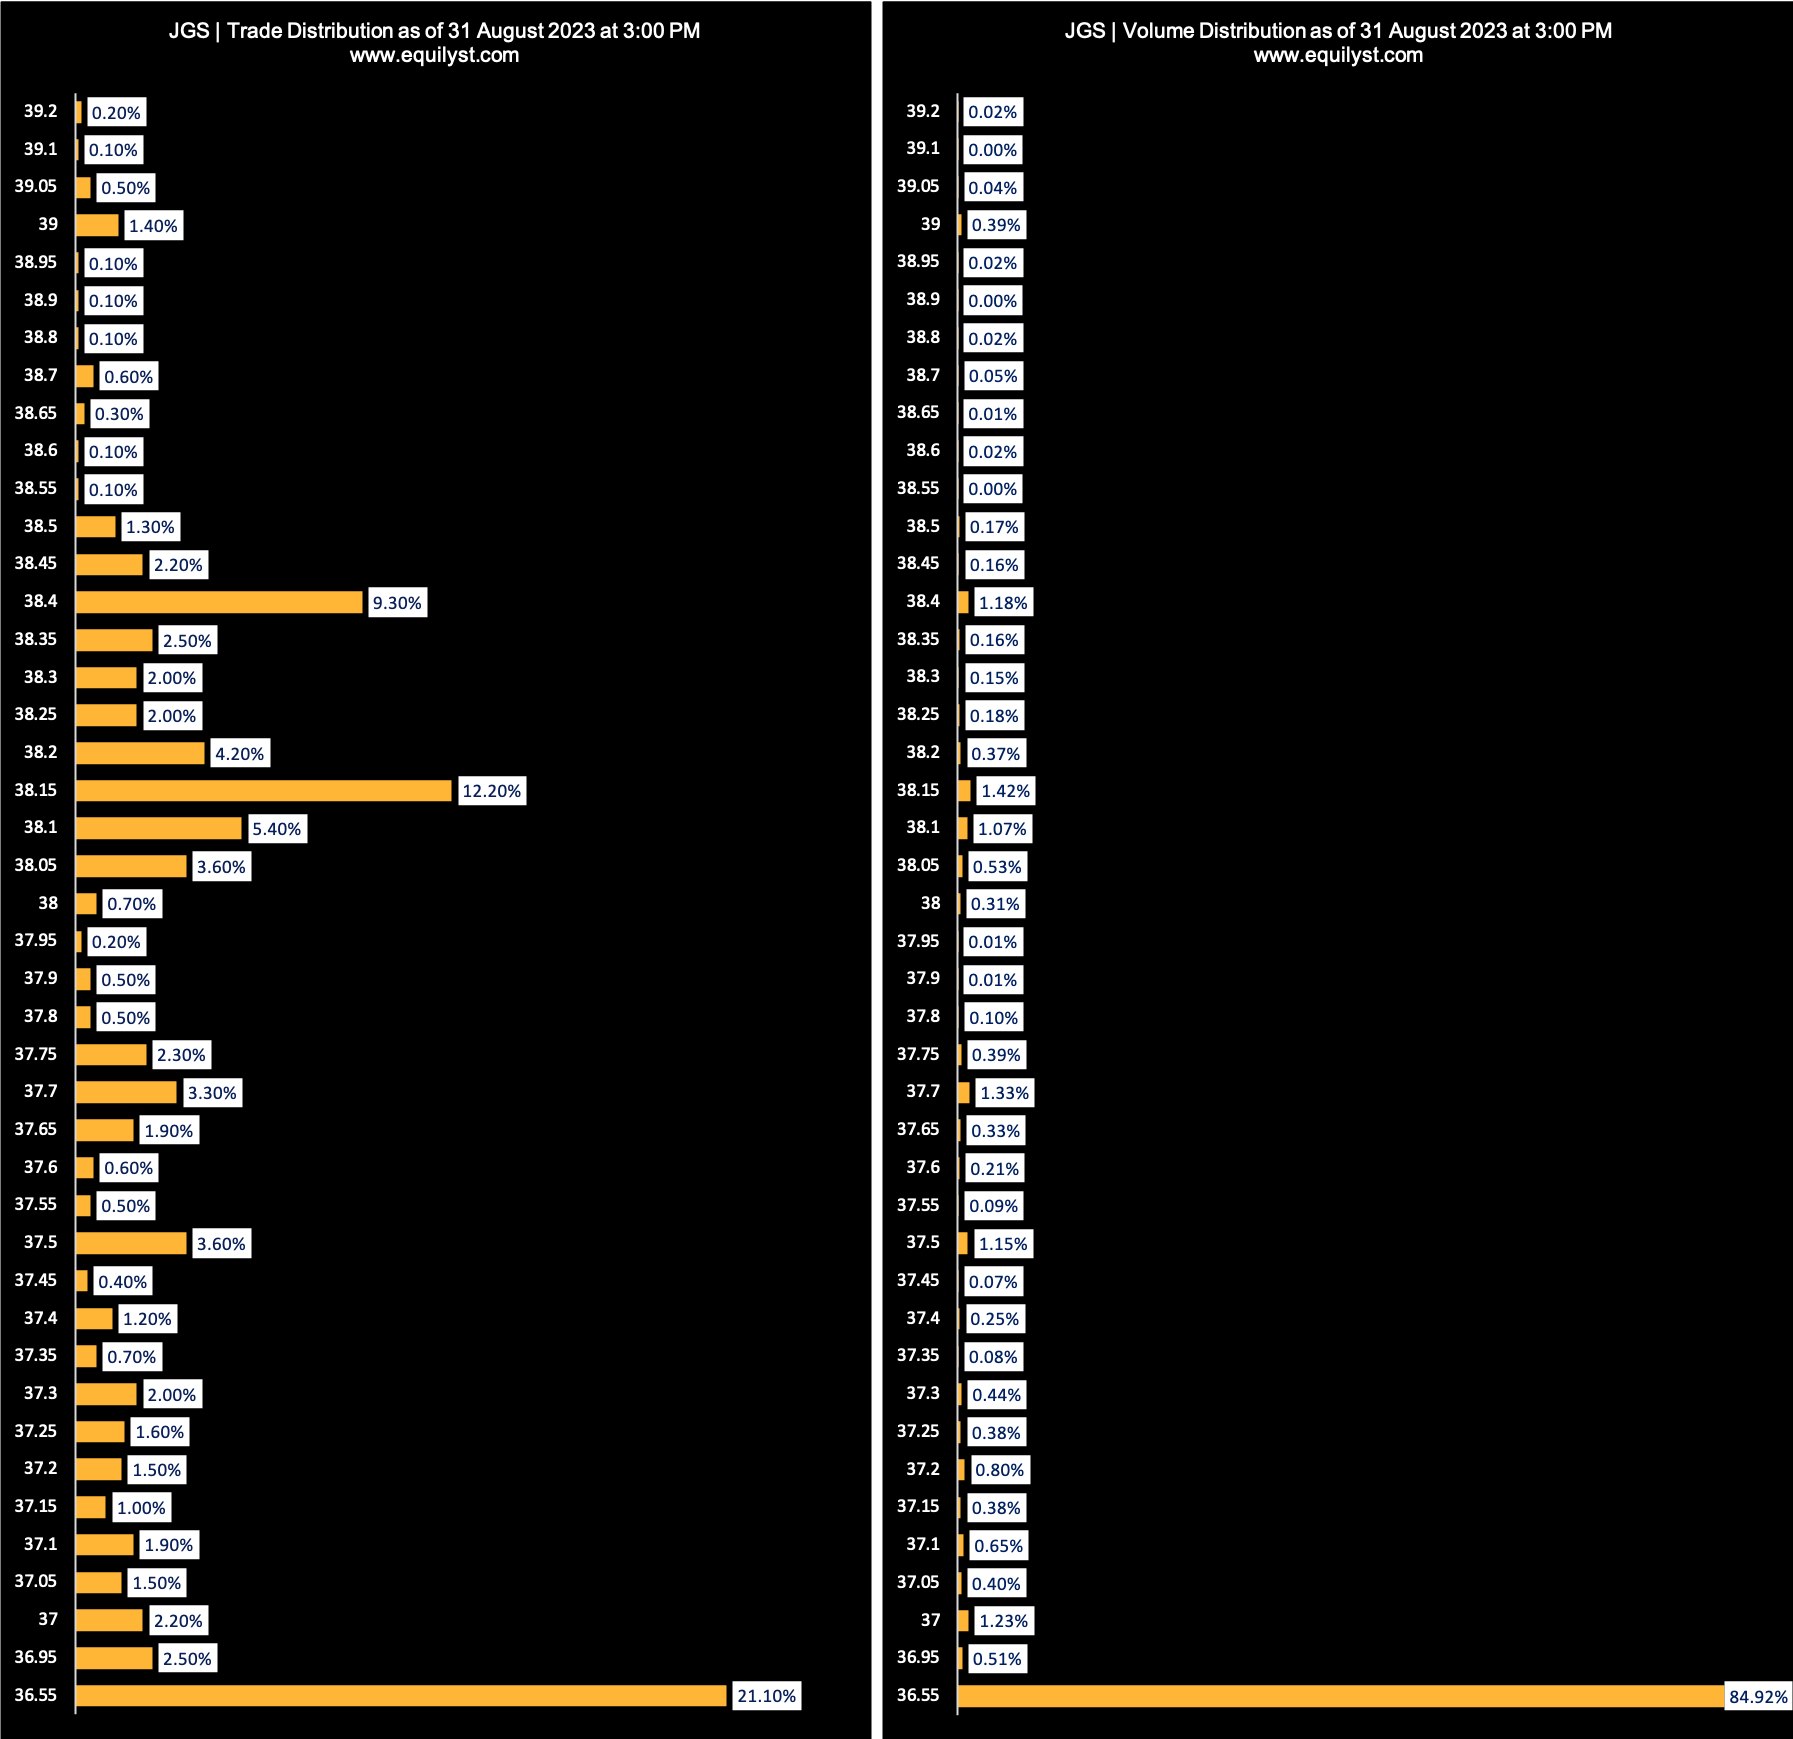
Stock Code: JGS
Price-to-Sales: 0.91
Dominant Range Index: BEARISH
Last Price: 36.55
VWAP: 36.73
Dominant Range: 36.55 – 36.55
 Rank: 7
Stock Code: LTG
Price-to-Sales: 0.90
Dominant Range Index: BEARISH
Last Price: 9.12
VWAP: 9.22
Dominant Range: 9.12 – 9.35
 Rank: 6
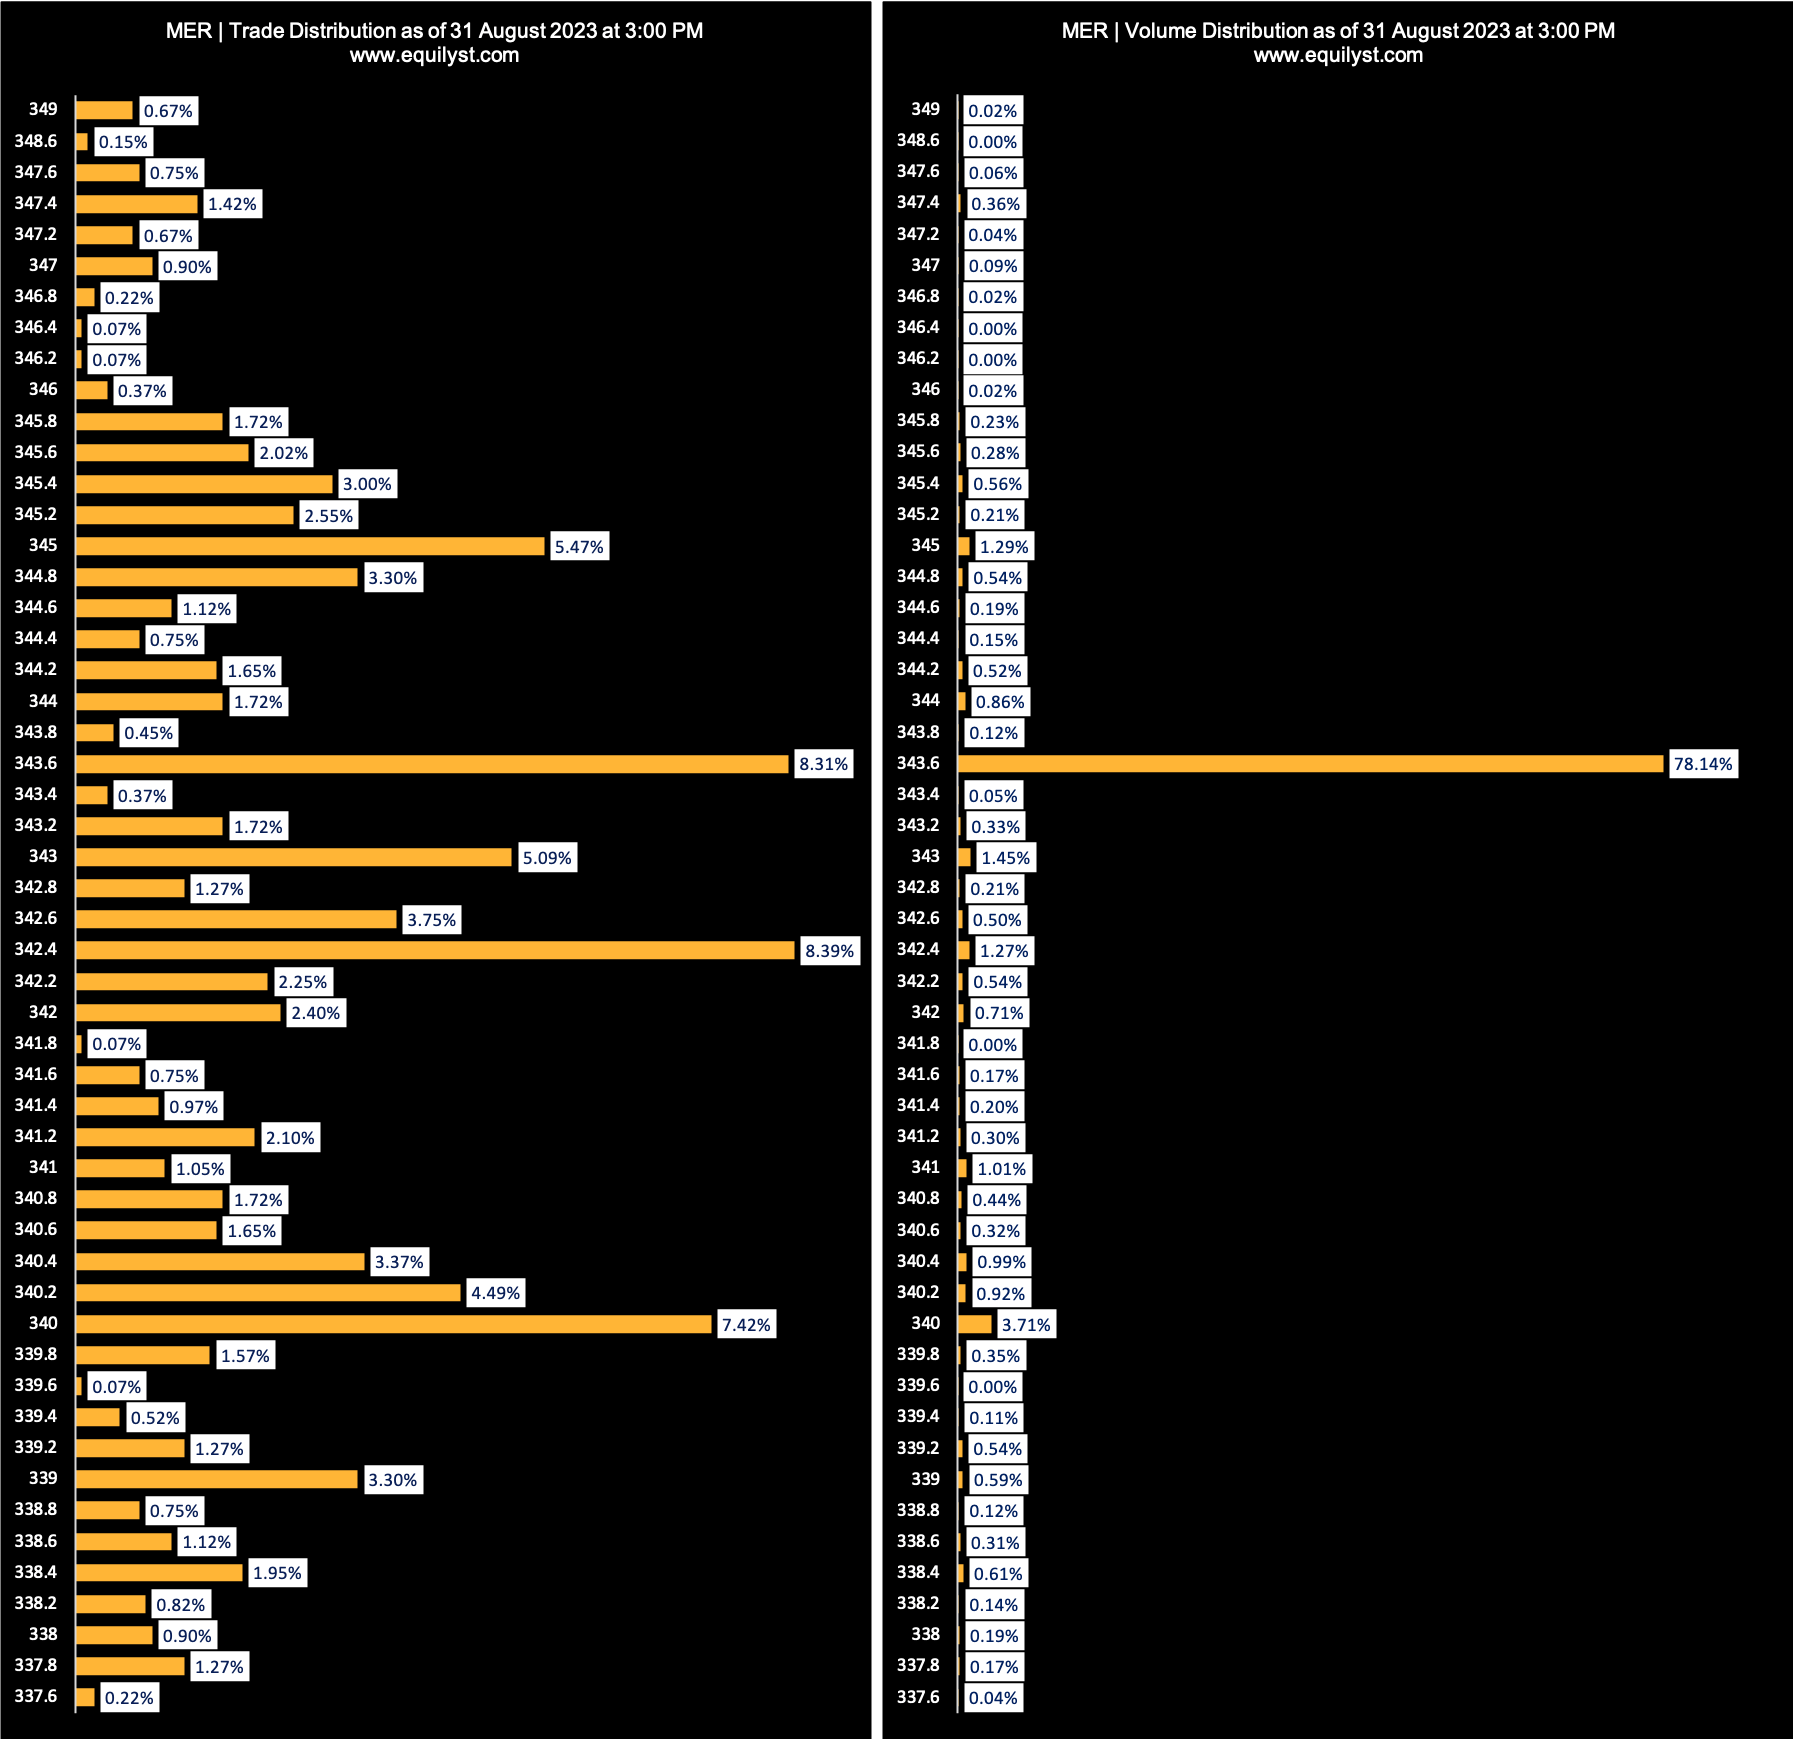
Stock Code: MER
Price-to-Sales: 0.86
Dominant Range Index: BULLISH
Last Price: 343.6
VWAP: 343.22
Dominant Range: 342.4 – 343.6
 Rank: 5
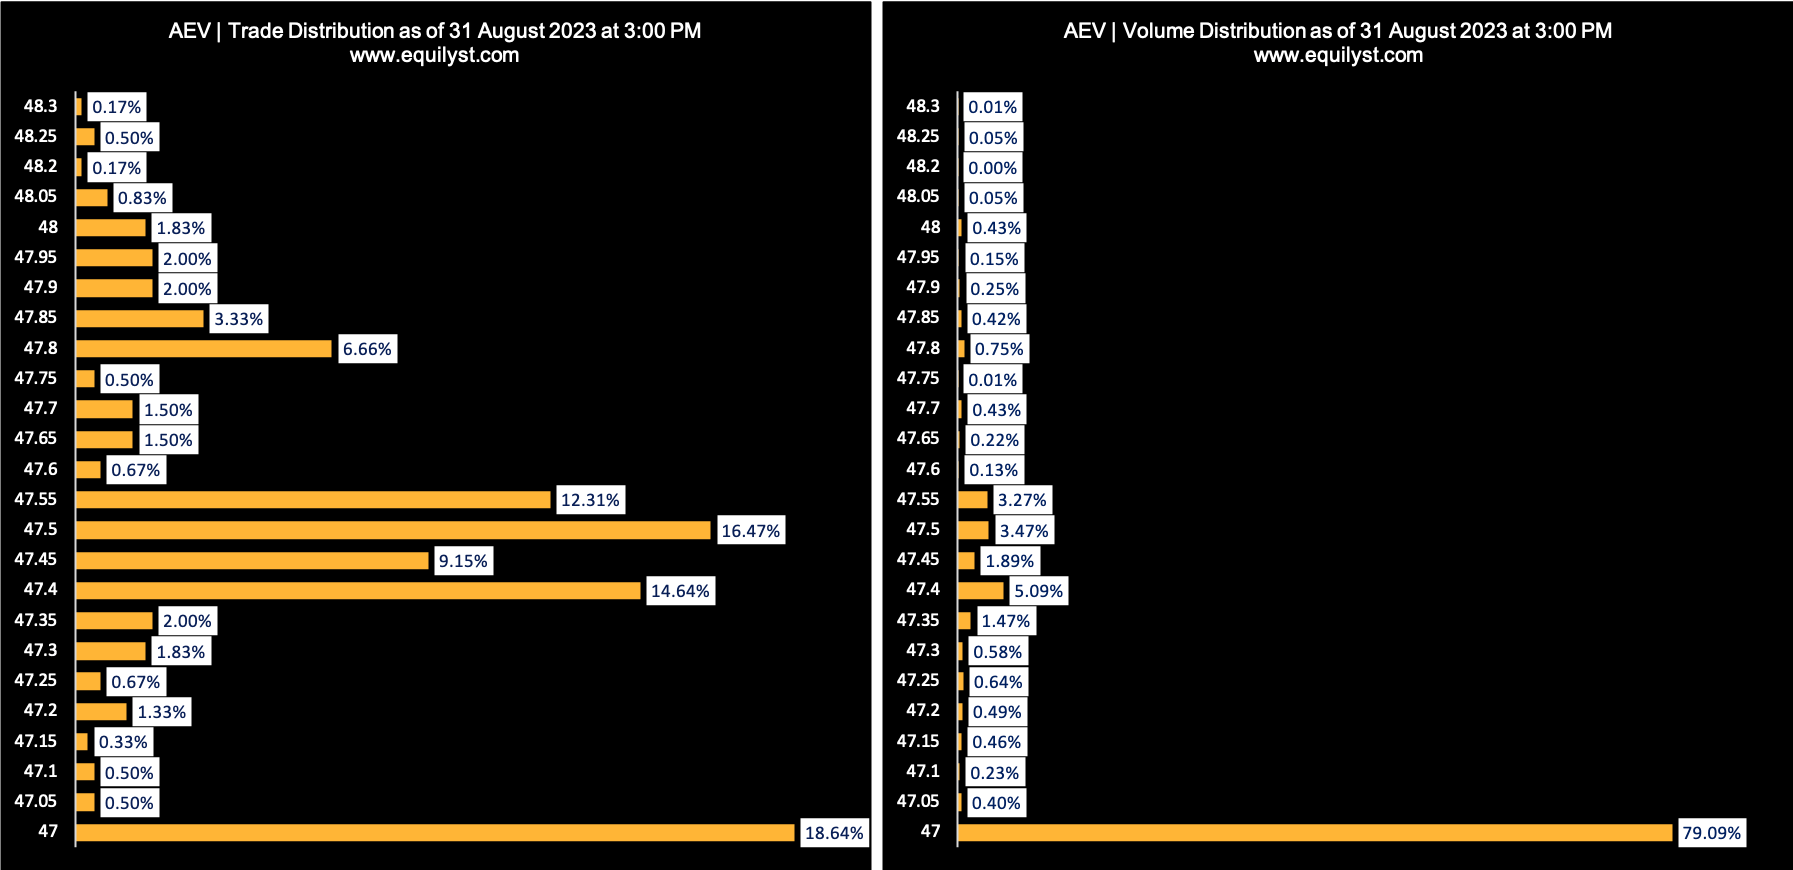
Stock Code: AEV
Price-to-Sales: 0.80
Dominant Range Index: BEARISH
Last Price: 47
VWAP: 47.10
Dominant Range: 47 – 47
 Rank: 4
Stock Code: AGI
Price-to-Sales: 0.58
Dominant Range Index: BULLISH
Last Price: 12.5
VWAP: 12.45
Dominant Range: 12.46 – 12.5
 Rank: 3
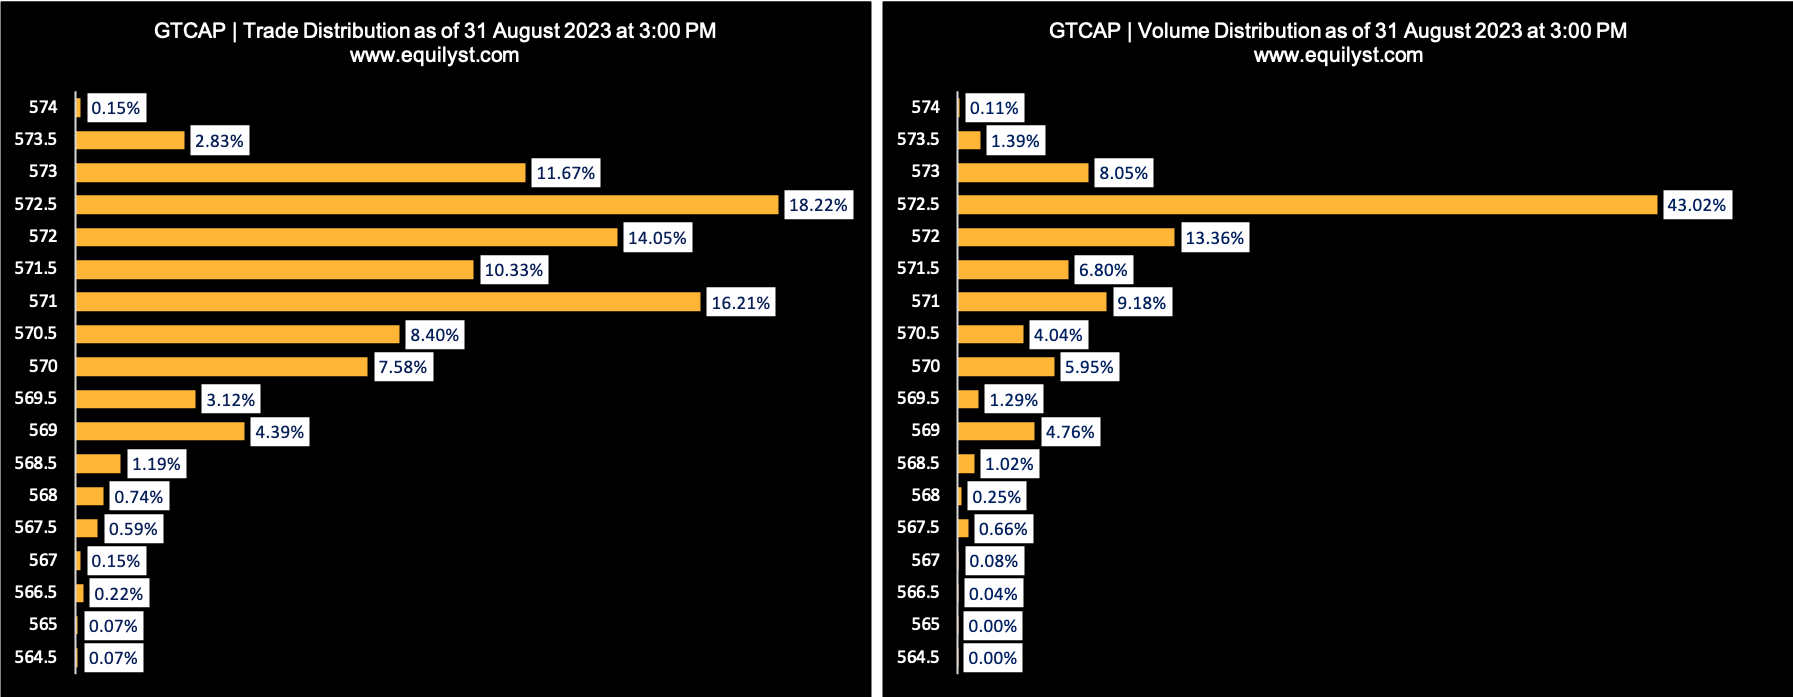
Stock Code: GTCAP
Price-to-Sales: 0.49
Dominant Range Index: BULLISH
Last Price: 572.5
VWAP: 571.76
Dominant Range: 572.5 – 572.5
 Rank: 2
Stock Code: PGOLD
Price-to-Sales: 0.42
Dominant Range Index: BULLISH
Last Price: 27.9
VWAP: 27.83
Dominant Range: 27.7 – 27.9
 Rank: 1
Stock Code: SMC
Price-to-Sales: 0.17
Dominant Range Index: BULLISH
Last Price: 104.5
VWAP: 104.49
Dominant Range: 104.5 – 104.5
MTD Market Sentiment for the 9 Undervalued PSE Bluechips With P/S Ratio of Less Than 1
How do you gauge the market sentiment?
By running a survey or observing discussions on stock market-related Facebook Groups?
But how do you verify the integrity or objectivity of their comments? That’s the problem!
Occasionally, I run surveys on Facebook Groups, but not to check the market sentiment but to ask them which stock they’d like me to write about in my next article. That way, I maintain the objectivity of my stock selection process as far as when deciding which stock to feature in my articles.
I check the overall market sentiment rating of a stock to help me decide whether I should hold my position since my trailing stop is still intact or pre-empt it.
The market sentiment also helps me estimate if the prevailing direction of the share price is likely to continue or reverse.
For example, if the stock is in a downtrend and the prevailing market sentiment is bearish, it means the downtrend is likely to continue.
If the stock is in a downtrend, but the market sentiment turns bullish, it’s a sign that investors might see a bullish reversal.
Again, and again, notice the adverbs I’m using – “likely” and “might”. We’re still talking about probabilities and not certainties.
Still, it’s better to be data-driven and be proven wrong by the market than make decisions based on gut feeling alone. The former gives you the opportunity to optimize something while the latter doesn’t.
I have an extensive explanation about why I created my proprietary Market Sentiment Index indicator in some articles on my website. Use the SEARCH box on this website and type “Market Sentiment” to read my other articles where I talked about this subject.
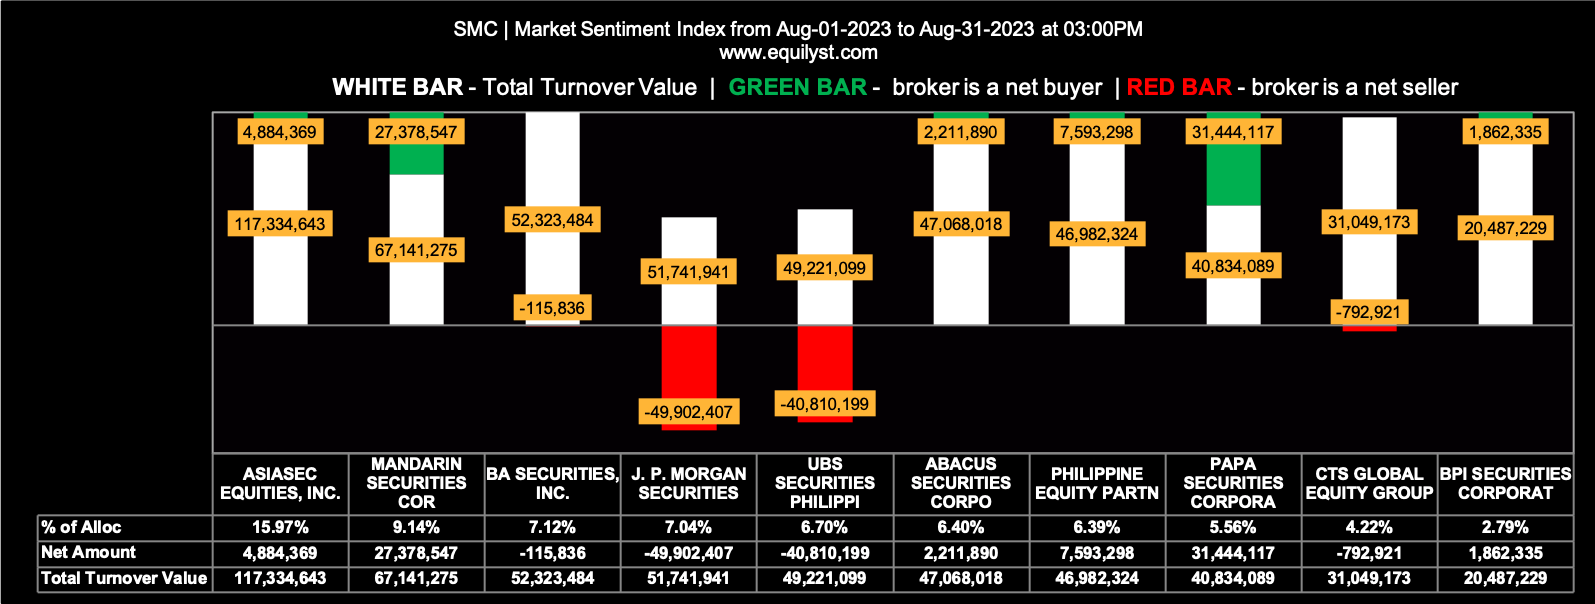
Here’s the month-to-date market sentiment index of each of the nine undervalued PSE bluechip stocks according to price-to-sales ratio:
Rank: 9
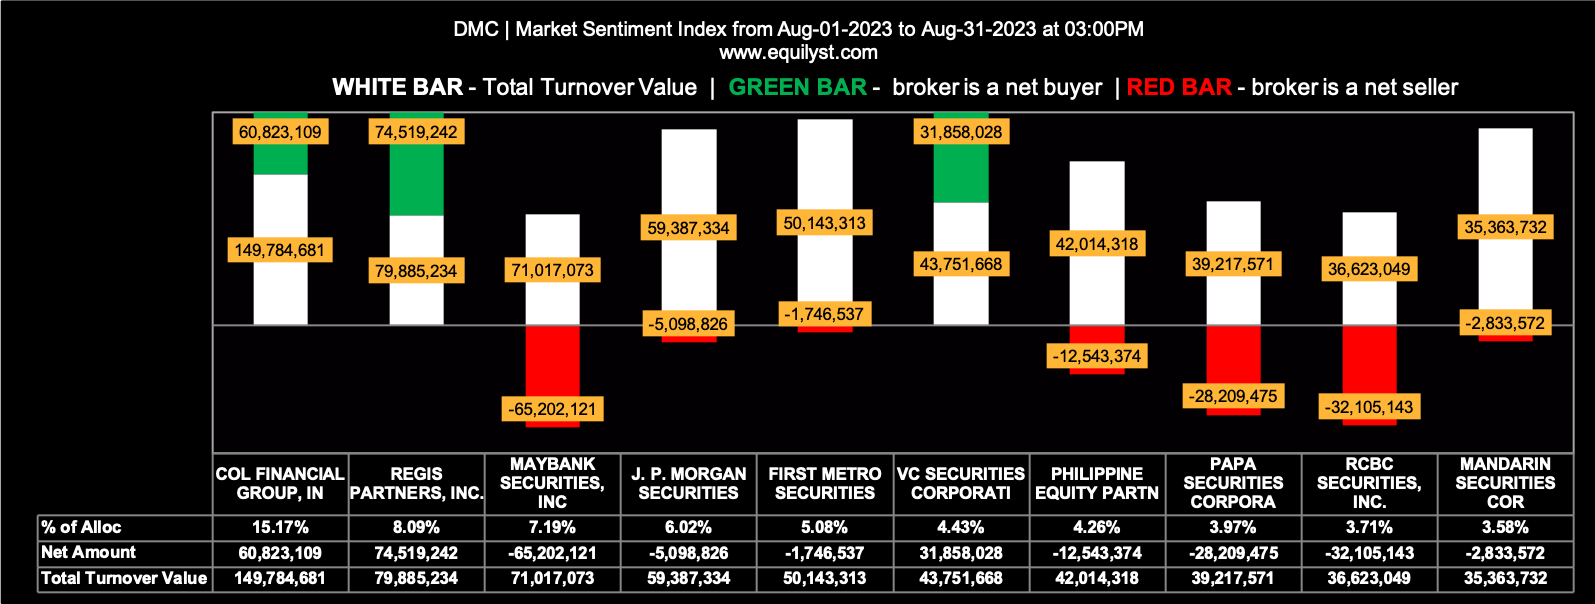
Stock Code: DMC
Market Sentiment Index: BEARISH
47 of the 89 participating brokers, or 52.81% of all participants, registered a positive Net Amount
33 of the 89 participating brokers, or 37.08% of all participants, registered a higher Buying Average than Selling Average
89 Participating Brokers’ Buying Average: ₱9.53728
89 Participating Brokers’ Selling Average: ₱9.63248
17 out of 89 participants, or 19.10% of all participants, registered a 100% BUYING activity
14 out of 89 participants, or 15.73% of all participants, registered a 100% SELLING activity
 Rank: 8
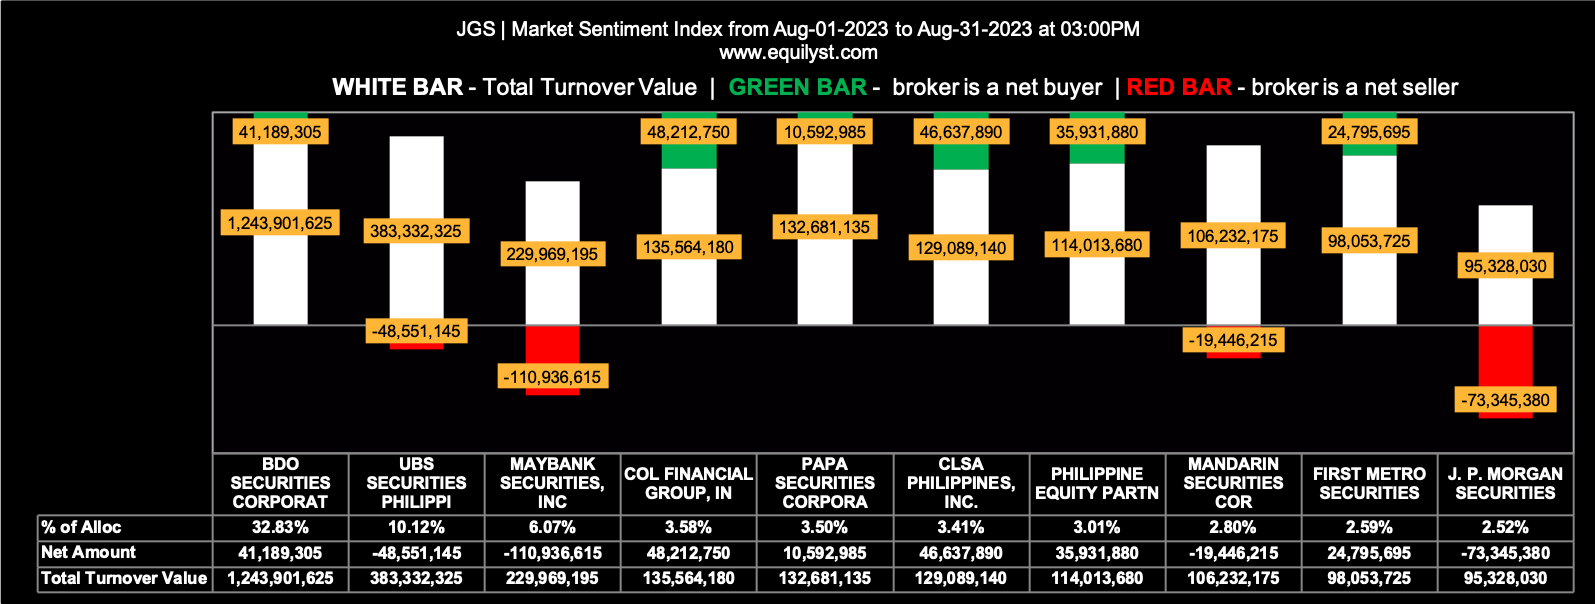
Stock Code: JGS
Price-to-Sales: 0.91
Market Sentiment Index: BULLISH
65 of the 84 participating brokers, or 77.38% of all participants, registered a positive Net Amount
43 of the 84 participating brokers, or 51.19% of all participants, registered a higher Buying Average than Selling Average
84 Participating Brokers’ Buying Average: ₱38.79537
84 Participating Brokers’ Selling Average: ₱38.98986
17 out of 84 participants, or 20.24% of all participants, registered a 100% BUYING activity
2 out of 84 participants, or 2.38% of all participants, registered a 100% SELLING activity
 Rank: 7
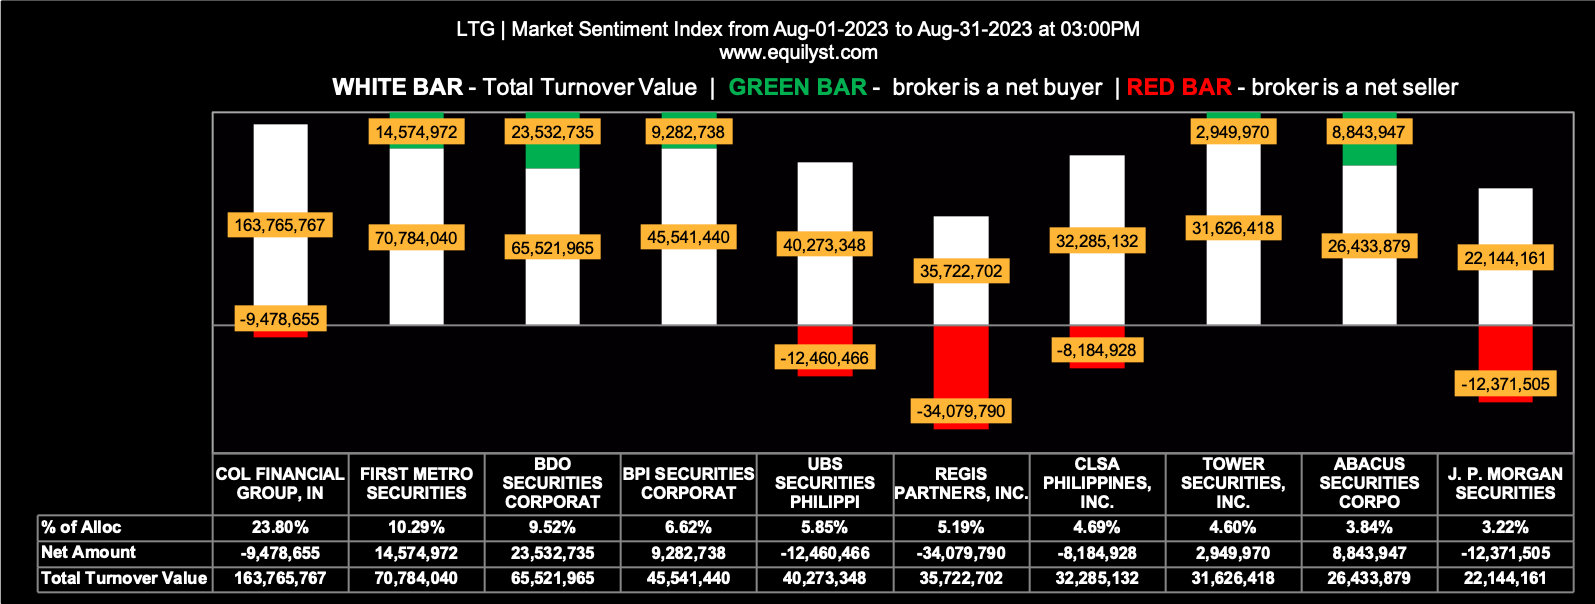
Stock Code: LTG
Price-to-Sales: 0.90
Market Sentiment Index: BULLISH
53 of the 76 participating brokers, or 69.74% of all participants, registered a positive Net Amount
43 of the 76 participating brokers, or 56.58% of all participants, registered a higher Buying Average than Selling Average
76 Participating Brokers’ Buying Average: ₱9.35243
76 Participating Brokers’ Selling Average: ₱9.39643
29 out of 76 participants, or 38.16% of all participants, registered a 100% BUYING activity
6 out of 76 participants, or 7.89% of all participants, registered a 100% SELLING activity
 Rank: 6
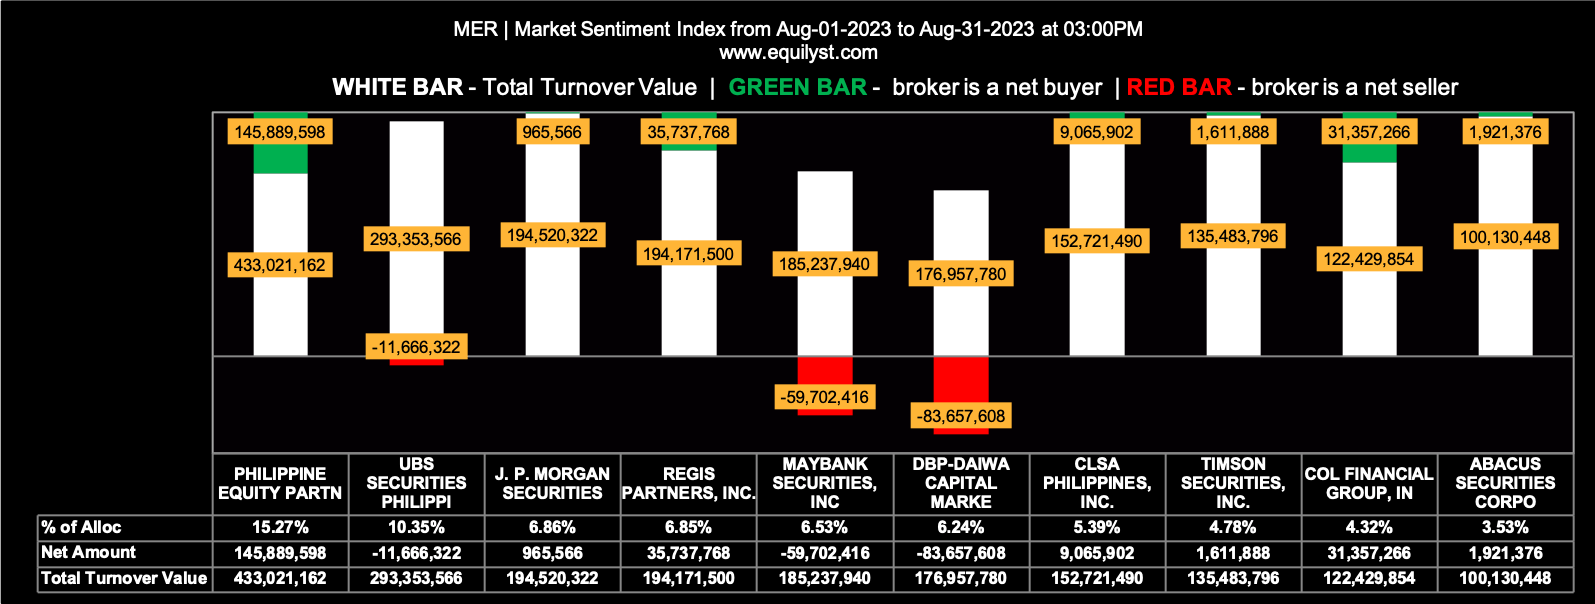
Stock Code: MER
Price-to-Sales: 0.86
Market Sentiment Index: BEARISH
33 of the 88 participating brokers, or 37.50% of all participants, registered a positive Net Amount
27 of the 88 participating brokers, or 30.68% of all participants, registered a higher Buying Average than Selling Average
88 Participating Brokers’ Buying Average: ₱341.81966
88 Participating Brokers’ Selling Average: ₱344.83525
4 out of 88 participants, or 4.55% of all participants, registered a 100% BUYING activity
20 out of 88 participants, or 22.73% of all participants, registered a 100% SELLING activity
 Rank: 5
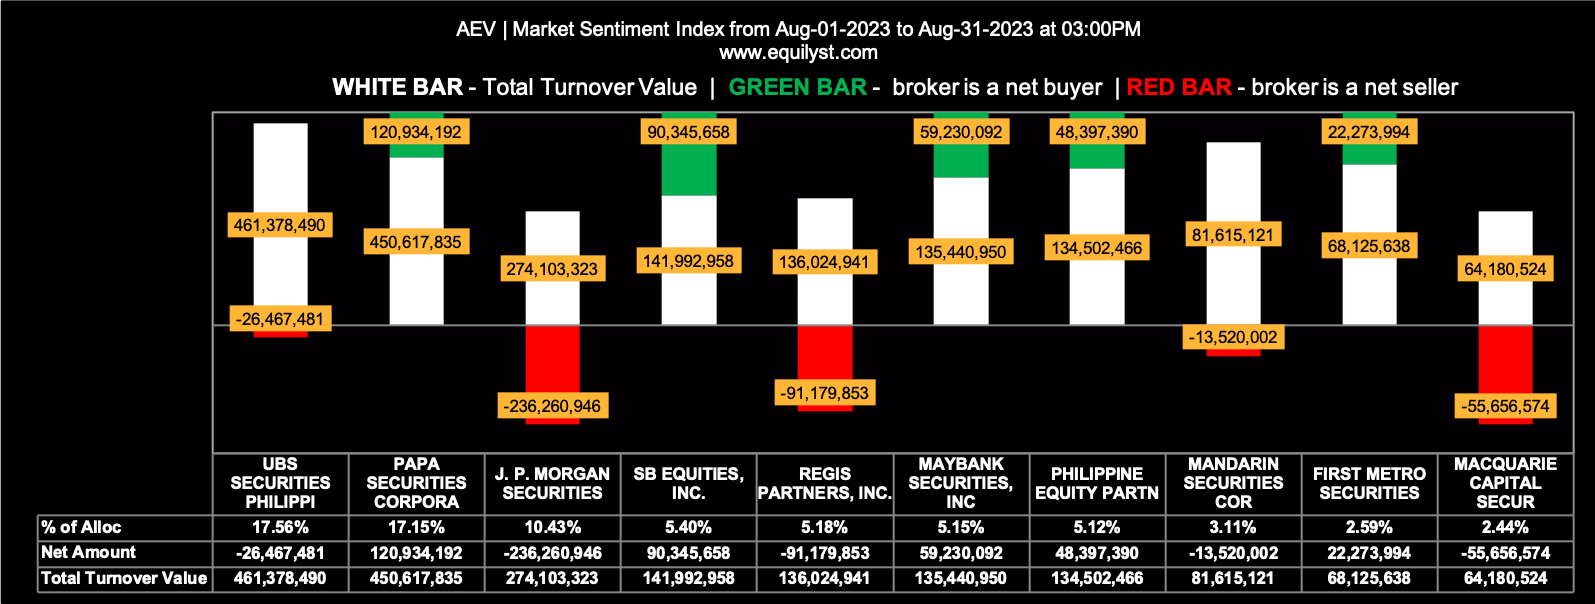
Stock Code: AEV
Price-to-Sales: 0.80
Market Sentiment Index: BULLISH
60 of the 80 participating brokers, or 75.00% of all participants, registered a positive Net Amount
45 of the 80 participating brokers, or 56.25% of all participants, registered a higher Buying Average than Selling Average
80 Participating Brokers’ Buying Average: ₱48.98369
80 Participating Brokers’ Selling Average: ₱49.11692
19 out of 80 participants, or 23.75% of all participants, registered a 100% BUYING activity
2 out of 80 participants, or 2.50% of all participants, registered a 100% SELLING activity
 Rank: 4
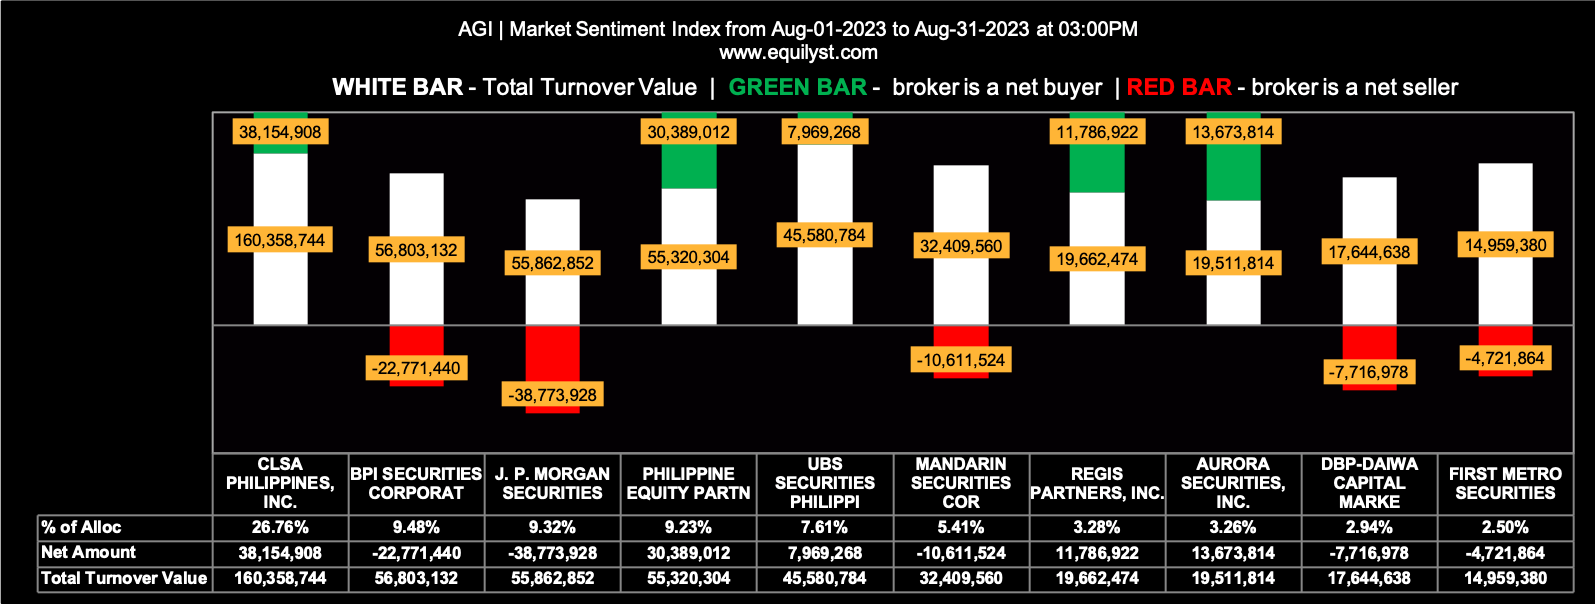
Stock Code: AGI
Price-to-Sales: 0.58
Market Sentiment Index: BEARISH
23 of the 68 participating brokers, or 33.82% of all participants, registered a positive Net Amount
21 of the 68 participating brokers, or 30.88% of all participants, registered a higher Buying Average than Selling Average
68 Participating Brokers’ Buying Average: ₱12.29622
68 Participating Brokers’ Selling Average: ₱12.48839
7 out of 68 participants, or 10.29% of all participants, registered a 100% BUYING activity
11 out of 68 participants, or 16.18% of all participants, registered a 100% SELLING activity
 Rank: 3
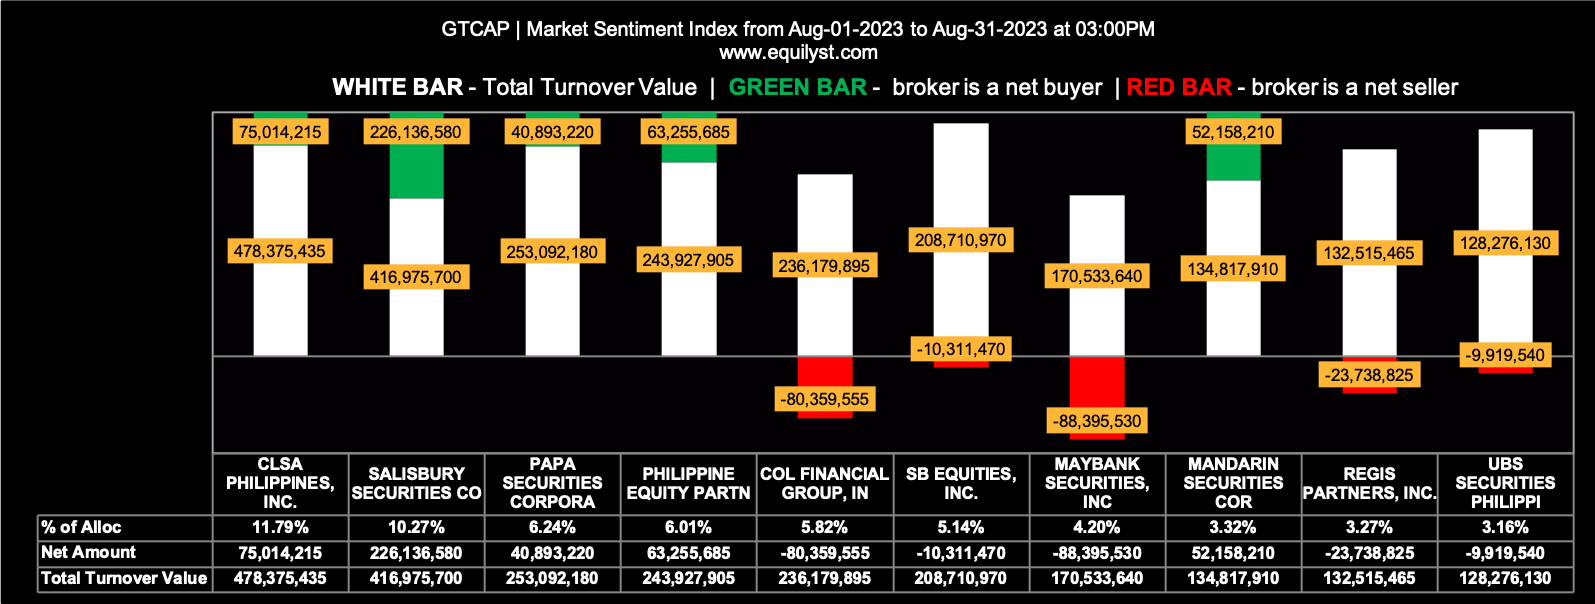
Stock Code: GTCAP
Price-to-Sales: 0.49
Market Sentiment Index: BEARISH
23 of the 91 participating brokers, or 25.27% of all participants, registered a positive Net Amount
24 of the 91 participating brokers, or 26.37% of all participants, registered a higher Buying Average than Selling Average
91 Participating Brokers’ Buying Average: ₱539.36873
91 Participating Brokers’ Selling Average: ₱545.84128
5 out of 91 participants, or 5.49% of all participants, registered a 100% BUYING activity
32 out of 91 participants, or 35.16% of all participants, registered a 100% SELLING activity
 Rank: 2
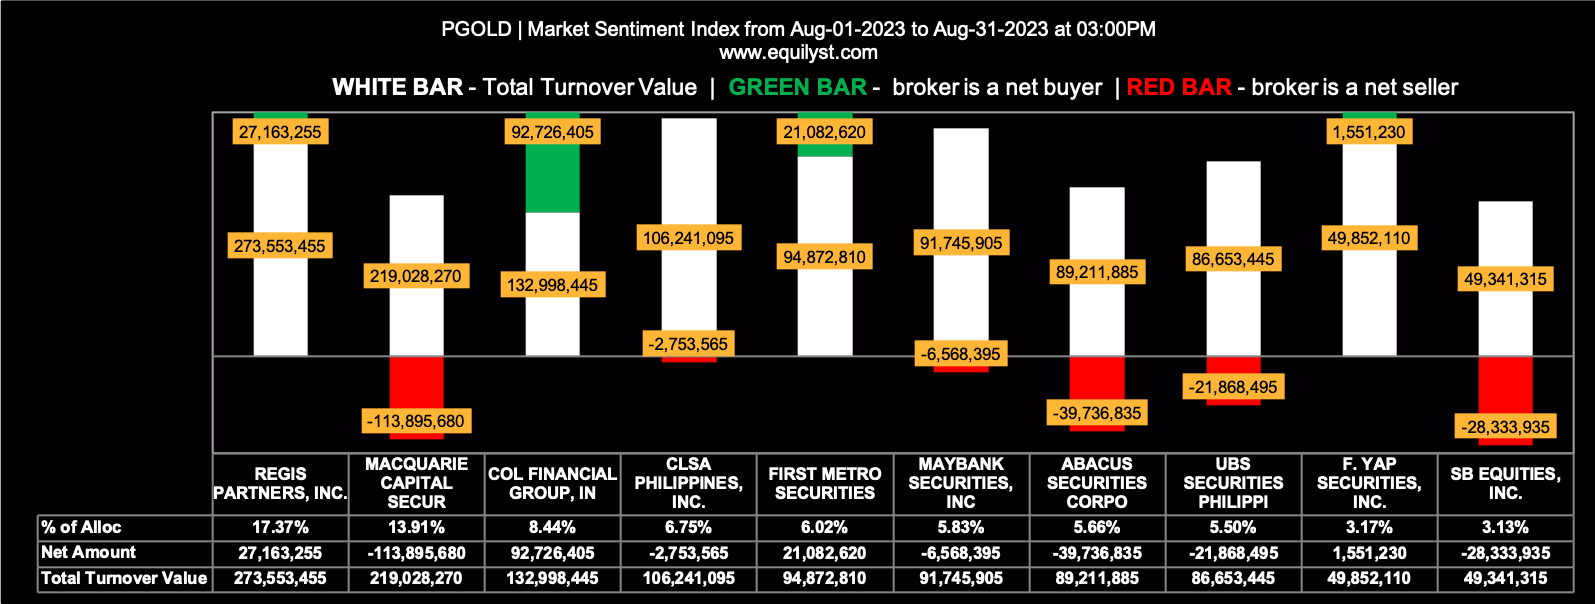
Stock Code: PGOLD
Price-to-Sales: 0.42
Market Sentiment Index: BULLISH
55 of the 78 participating brokers, or 70.51% of all participants, registered a positive Net Amount
47 of the 78 participating brokers, or 60.26% of all participants, registered a higher Buying Average than Selling Average
78 Participating Brokers’ Buying Average: ₱27.89643
78 Participating Brokers’ Selling Average: ₱27.97489
30 out of 78 participants, or 38.46% of all participants, registered a 100% BUYING activity
3 out of 78 participants, or 3.85% of all participants, registered a 100% SELLING activity
 Rank: 1
Stock Code: SMC
Price-to-Sales: 0.17
Market Sentiment Index: BEARISH
29 of the 73 participating brokers, or 39.73% of all participants, registered a positive Net Amount
19 of the 73 participating brokers, or 26.03% of all participants, registered a higher Buying Average than Selling Average
73 Participating Brokers’ Buying Average: ₱102.90189
73 Participating Brokers’ Selling Average: ₱104.28313
5 out of 73 participants, or 6.85% of all participants, registered a 100% BUYING activity
21 out of 73 participants, or 28.77% of all participants, registered a 100% SELLING activity
Which Among the 9 Undervalued PSE Bluechips Will You Buy?
I’ve presented to you some pieces of information vital in making a data-driven stock investment decision. After synthesizing this stuff with your methodology relative to your risk tolerance, which one will you buy and why? Let me know in the comments below.
Are you looking to hire a crypto or stock investment consultant? Complete this form to avail yourself of my crypto and stock market consulting service.
Are you looking to hire a content writer for your crypto and stock investment website? Here’s the form you need to fill out.
- MA, BDO, ALI, URC, PX: Is Their Dominant Range Pointing to a Breakout? - March 14, 2025
- Tracking Market Sentiment: MTD Ratings for 30 Bluechip Stocks (March 2025) - March 13, 2025
- PSEi Stalls Below 6,260 as Market Awaits Political Shift - March 12, 2025


