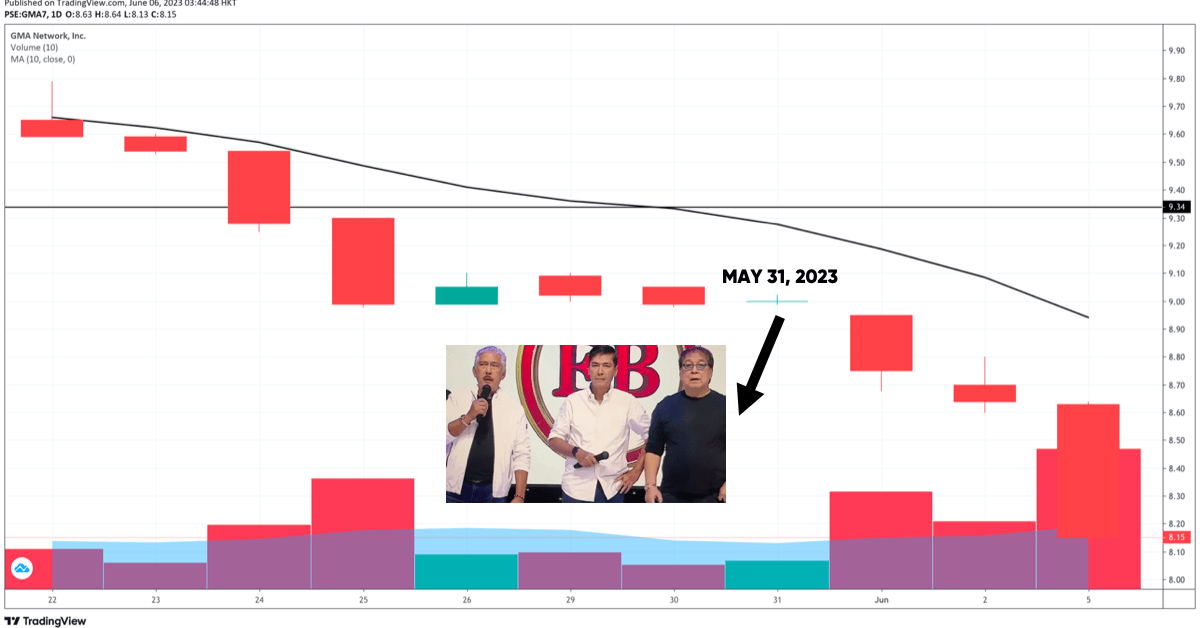
Former Senate President Tito Sotto, Vic Sotto, and Joey De Leon, Eat Bulaga’s super trio, quit from TAPE, Inc., last May 31, 2023. TAPE is the producer EAT BULAGA!, the longest-running noontime variety show in the Philippines.
Some traders and investors asked me on LinkedIn, Twitter, and Facebook if the quitting of the TVJ from TAPE last May 31, 2023 is correlated to or caused the dropping of the share price of GMA7 after May 31, 2023.
Before you follow my investigation, I’d like to define correlation and causation.
Defining Correlation and Causation
Correlation describes a statistical relationship between two variables, indicating how they tend to vary together. It measures the strength and direction of the relationship but does not imply a cause-and-effect connection.
In other words, when two variables are correlated, changes in one variable are associated with changes in the other, but it does not necessarily mean that one variable causes the changes in the other.
On the other hand, causation refers to a cause-and-effect relationship between variables, suggesting that changes in one variable directly influence or cause changes in another variable. Establishing causation requires additional evidence beyond correlation, such as controlled experiments, randomized trials, or strong theoretical justification.
How Has the Trend of GMA7 Been?
I’d like to start with this question: Has the GMA7 share price not been in the downtrend channel before the mass resignation of hosts and staff of EAT BULAGA!?
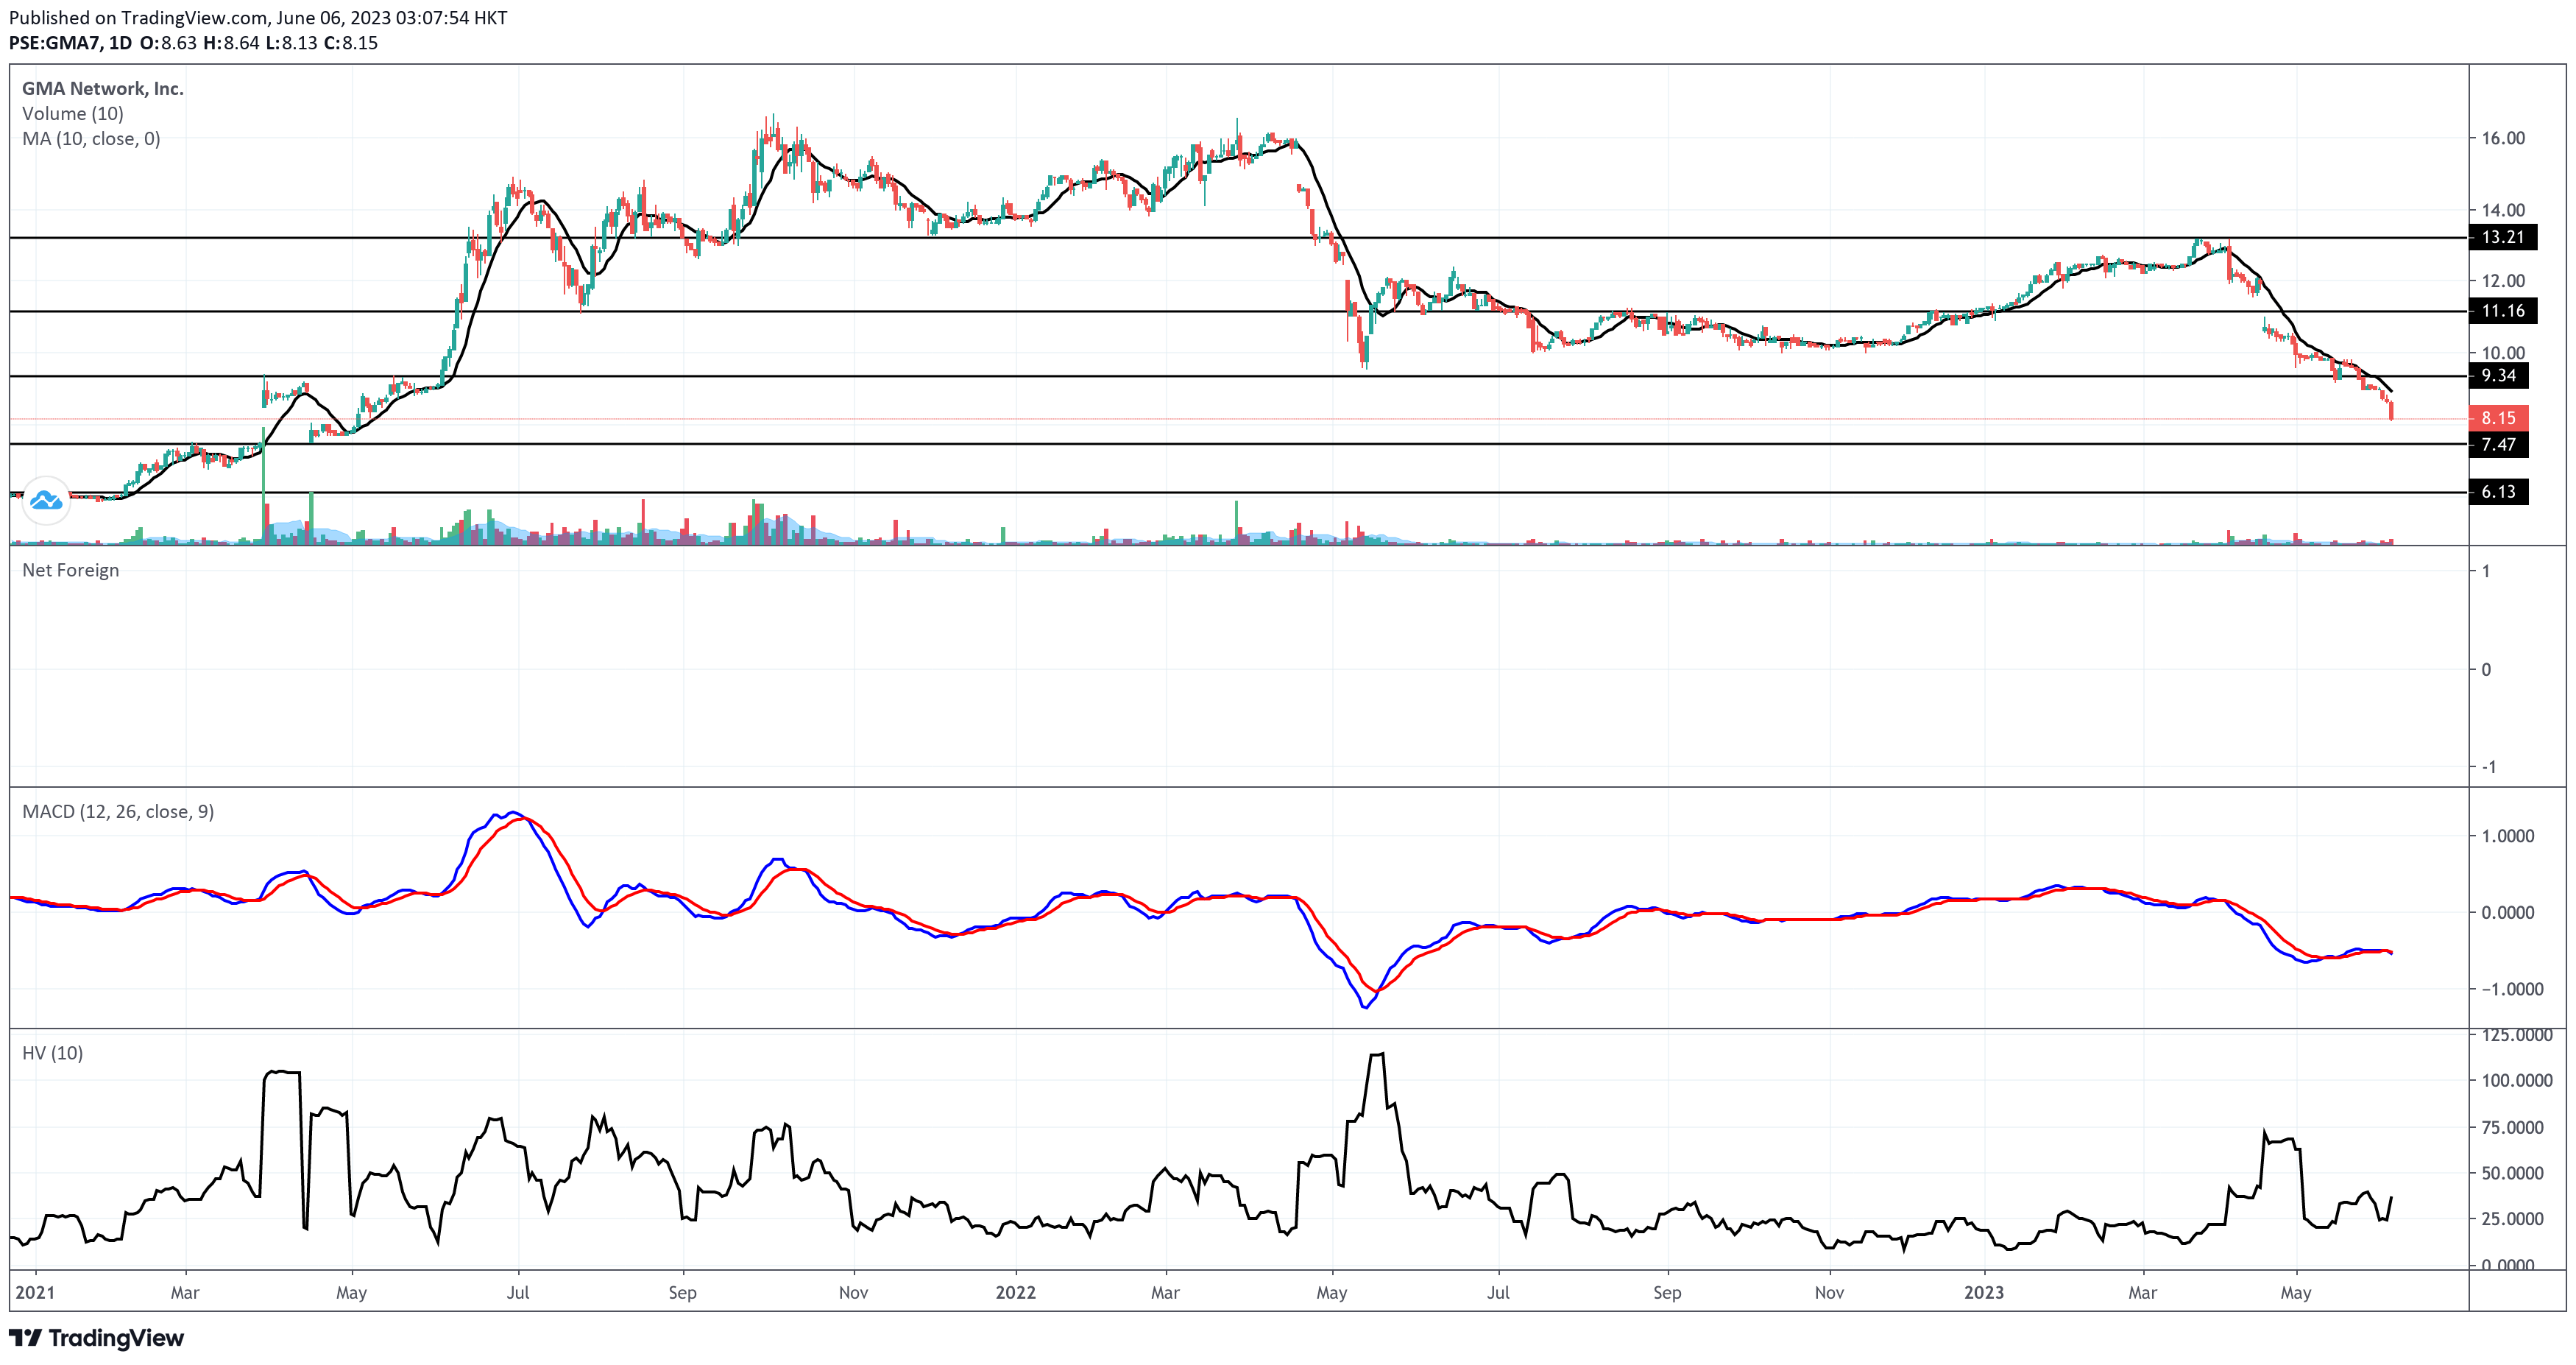
Look at the daily chart of GMA7.
GMA7 has traversed the downtrend territory six months after hitting its all-time high in October 2021. It attempted to elevate above the P13.20, only to be met with resistance.
The Cash Dividend Narrative
Then came the P1.10/share cash dividend with an ex-dividend date of April 18, 2023.
What usually happens on the Ex-Dividend Date of dividend-issuing companies?
The share price adjusts!
The adjustment in share price on the ex-dividend date reflects the fact that the dividend value is essentially being removed from the stock. The market takes into account the expected dividend payment and factors it into the stock’s value. As a result, when a stock goes ex-dividend, the share price tends to decrease by an amount roughly equivalent to the dividend per share.
If you’re looking for an example of the proverb “there’s no such thing as free lunch”, this is it!
The closing price on April 17, 2023 was P11.94. The April 18, 2023 closing price was P10.70, 10.39% lower than the previous trading day.
The P1.10/share cash dividend was 9.21% of the closing price of P11.94 on April 17, 2023. The adjustment percentage at the closing of April 18 was pretty close to that day’s Day Change.
GMA Network (GMA7) Technical Analysis
In addition to all these technical narratives and historical price actions, GMA7’s share price has already been below its 10-day simple moving average for over two months.
GMA7’s main support is near P7.50, while the immediate resistance is pegged near P9.35. The closing price on June 5, 2023 is closer to the support than the resistance level.
The red volume bars for the past three consecutive trading days exceeded 100% of the stock’s 10-day volume average. That signifies the growing appetite of shareholders to liquidate or sell their shares.
Meanwhile, I spotted a death cross on the MACD’s histogram on June 2, 2023. That adds more hungry bears in the den.
Trade and Volume Analysis – June 5, 2023
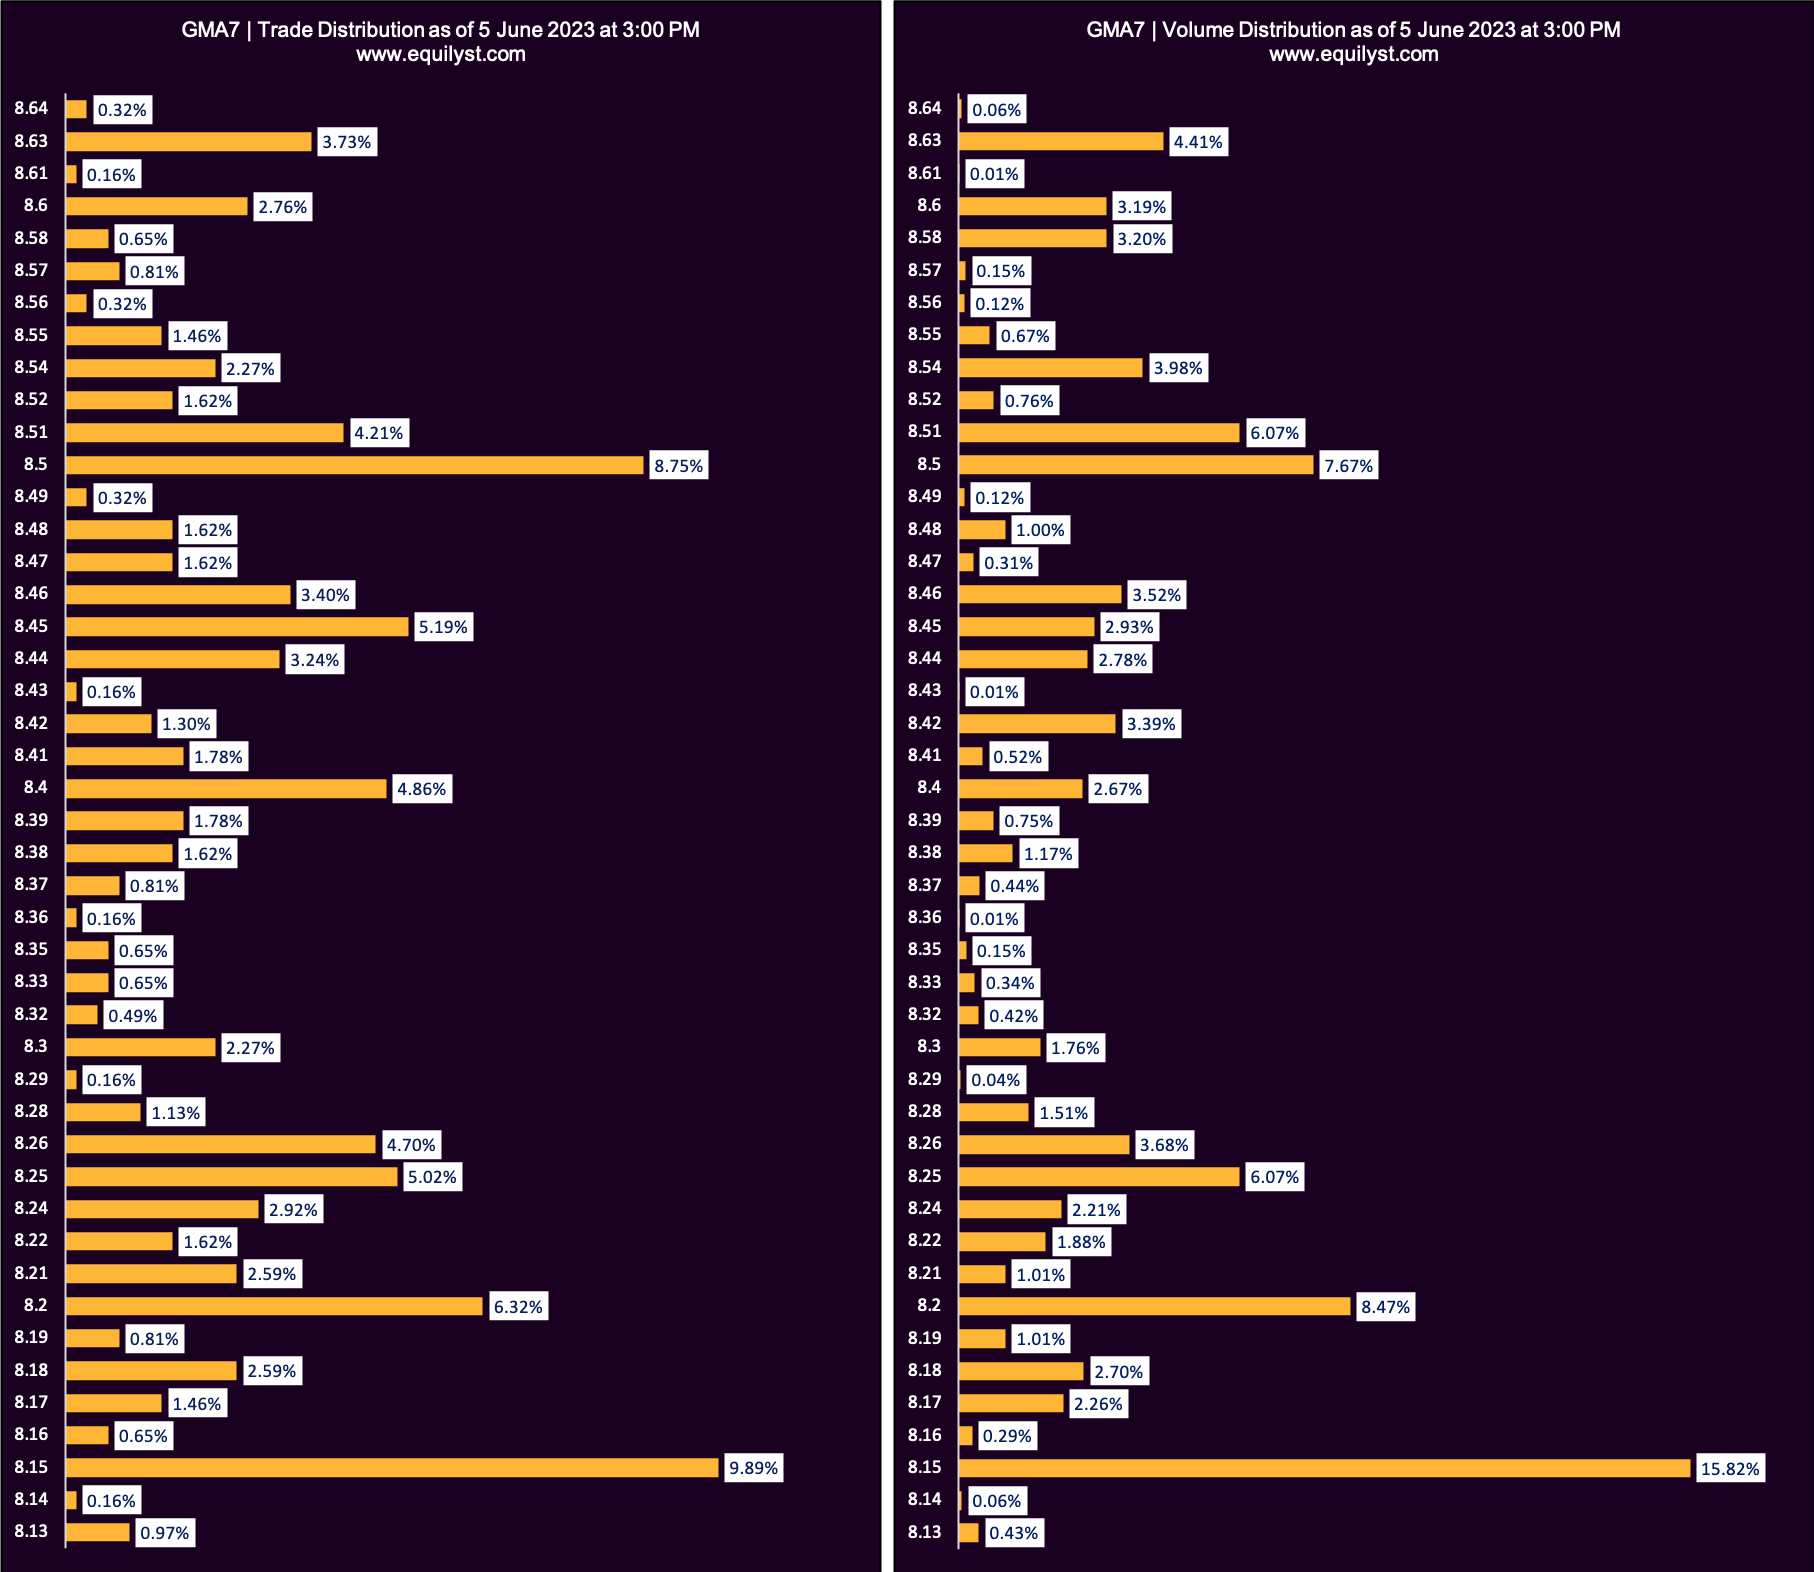
Dominant Range Index: BEARISH
Last Price: 8.15
VWAP: 8.35
Dominant Range: 8.15 – 8.15
My proprietary Dominant Range Index issued a bearish rating due to the closing price being closer to the intraday low than the intraday high and with the closing price being lower than its volume-weighted average price (VWAP) as of closing on June 5, 2023. That’s another bear in the den!
Market Sentiment Analysis – June 5, 2023
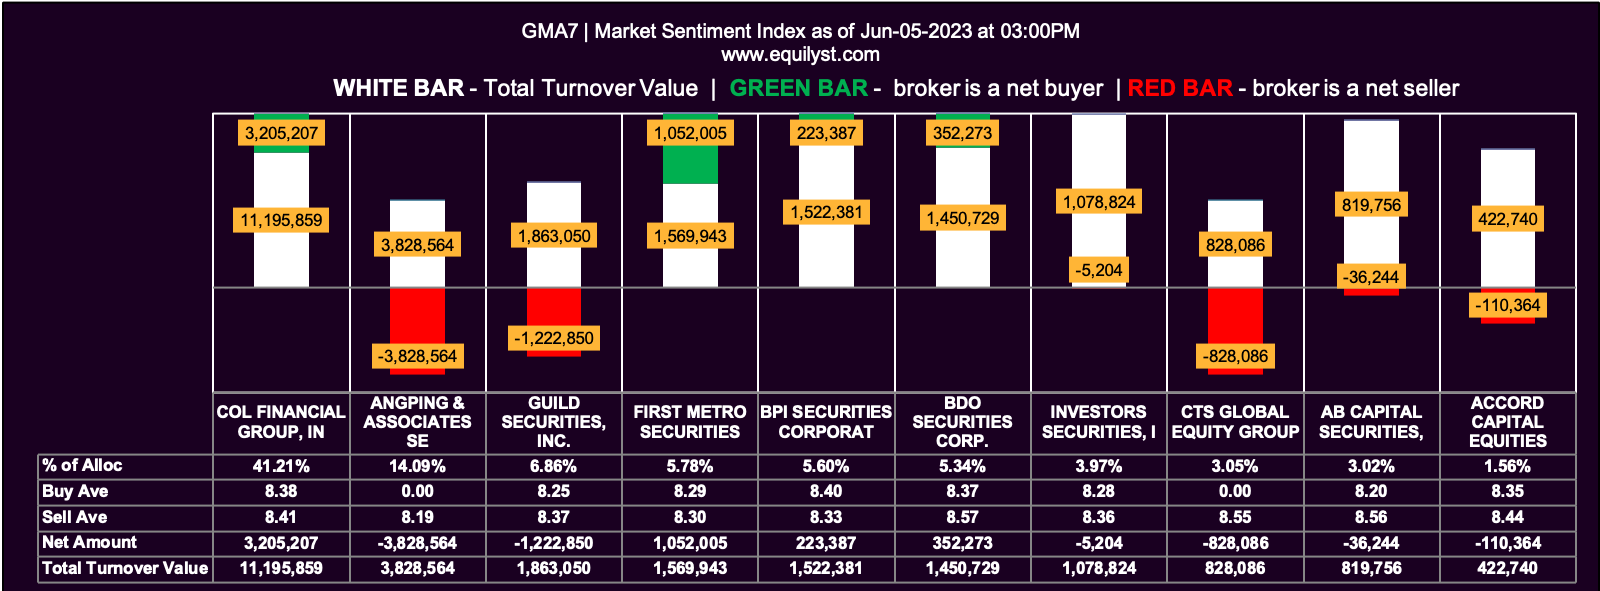
Market Sentiment Index: BULLISH
21 of the 34 participating brokers, or 61.76% of all participants, registered a positive Net Amount
18 of the 34 participating brokers, or 52.94% of all participants, registered a higher Buying Average than Selling Average
34 Participating Brokers’ Buying Average: ₱8.31361
34 Participating Brokers’ Selling Average: ₱8.39227
15 out of 34 participants, or 44.12% of all participants, registered a 100% BUYING activity
5 out of 34 participants, or 14.71% of all participants, registered a 100% SELLING activity
My proprietary Market Sentiment Index indicator raised a bullish rating for June 5, 2023 due to the high positive Net Amount percentage, higher Buying Average than Selling Average, and a high percentage of participants with 100% Buying Average.
Market Sentiment Index – May 2023 (MTD)
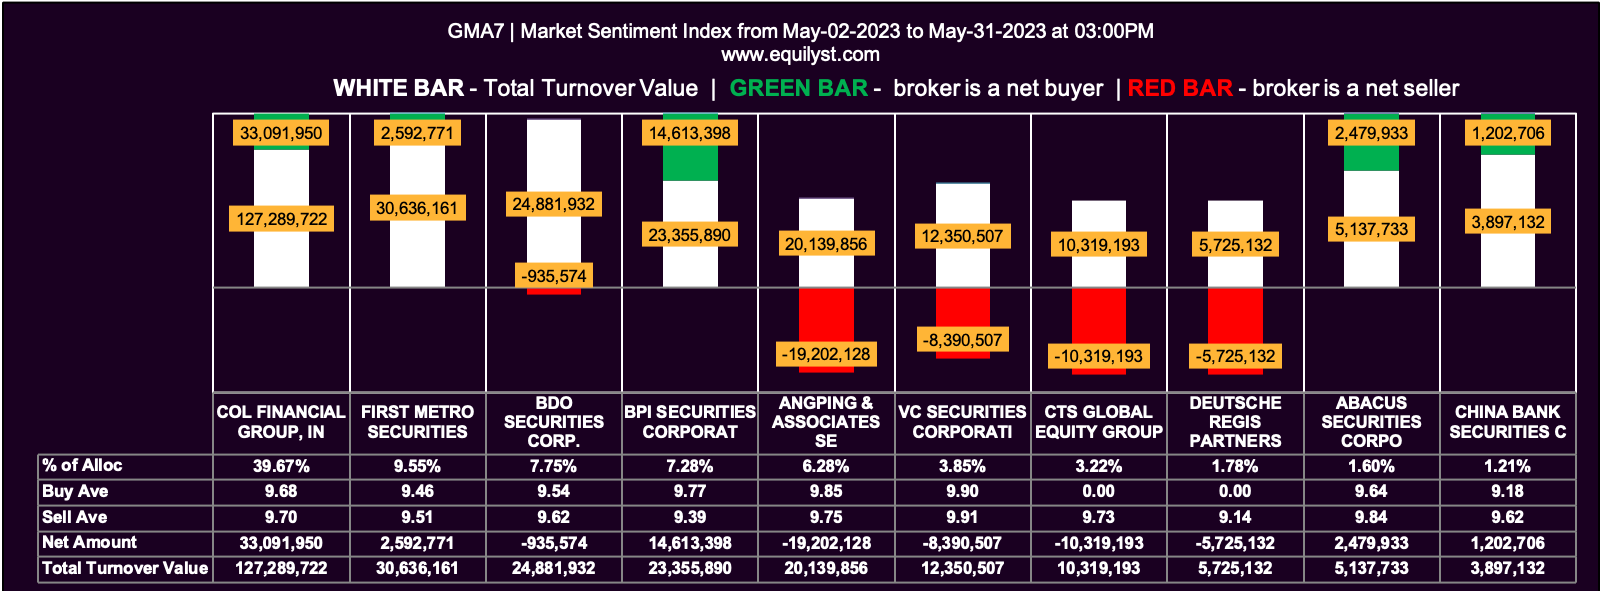
We’re very short-sighted if we do not stretch our data coverage to May 2023. So, see the reading of my Market Sentiment Index for May 2023. It mirrors the bearishness of all other indicators.
Market Sentiment Index: BEARISH
43 of the 73 participating brokers, or 58.90% of all participants, registered a positive Net Amount
33 of the 73 participating brokers, or 45.21% of all participants, registered a higher Buying Average than Selling Average
73 Participating Brokers’ Buying Average: ₱9.57024
73 Participating Brokers’ Selling Average: ₱9.65847
22 out of 73 participants, or 30.14% of all participants, registered a 100% BUYING activity
11 out of 73 participants, or 15.07% of all participants, registered a 100% SELLING activity
Is There a Correlation or Causation?
Where do all these data point us now?
So, is there a correlation or causation between the dropping of the share price of GMA7 and the quitting of the TVJ and their co-hosts at TAPE, Inc.?
GMA7 has already been trading in the downtrend channel even before this TVJ-TAPE or EAT BULAGA! fiasco started.
There’s neither a correlation nor causation.
The share price of GMA7 continues to go down not because the TVJ of EAT BULAGA! quits, but the stockholders don’t see a compelling reason to hold their position and buy more shares yet.
Remember, the downtrend is more likely to continue as long as the Day Change is negative and the volume is higher than 100% of the stock’s 10-day volume average.
What to Do if You Have GMA7
Consider reducing the percentage of risk applied in your trailing stop. The price is likely to kiss the support near P7.45. Do not top up. Unless you buy P1 million shares thrice every trading day, you cannot fabricate an inorganic bullish market sentiment.
Stop fooling yourself by believing that you’re buying more for less, even when all data-driven bases remind you to err on the side of caution. What are you? A bored billionaire?
Did you say you want to apply peso-cost averaging while GMA7 is in this situation? Again, what are you? A bored billionaire who wants to burn 1.5 calories for every click of the index finger on the mouse?
What to Do if You Don’t Have GMA7
Good! Don’t buy GMA7 yet unless and until you establish a data-driven buy case.
If you’re one of my clients, calculate your reward-to-risk ratio if, and only if, my Evergreen Strategy’s algorithm issues a confirmed buy signal. Only when you’re happy with the ratio should you consider doing a test buy within the prevailing dominant range.
If you’re more confused than clarified, consider registering for my stock market consultancy service so I can teach you my entire methodology online.
- MA, BDO, ALI, URC, PX: Is Their Dominant Range Pointing to a Breakout? - March 14, 2025
- Tracking Market Sentiment: MTD Ratings for 30 Bluechip Stocks (March 2025) - March 13, 2025
- PSEi Stalls Below 6,260 as Market Awaits Political Shift - March 12, 2025


