Yesterday, I wrote and published a report entitled “TVJ of EAT BULAGA! Quits, GMA7 Share Price Dips: Correlation or Causation?”
That report was seen nearly 11,000 times on Equilyst Analytics’ Twitter account, not counting the impressions and reactions it garnered from our social media accounts.
A few hours ago, the TVJ announced they’d found their new home at TV5.
They’ve finally moved on to a new beginning.
How about the market sentiment in trading GMA7 shares?
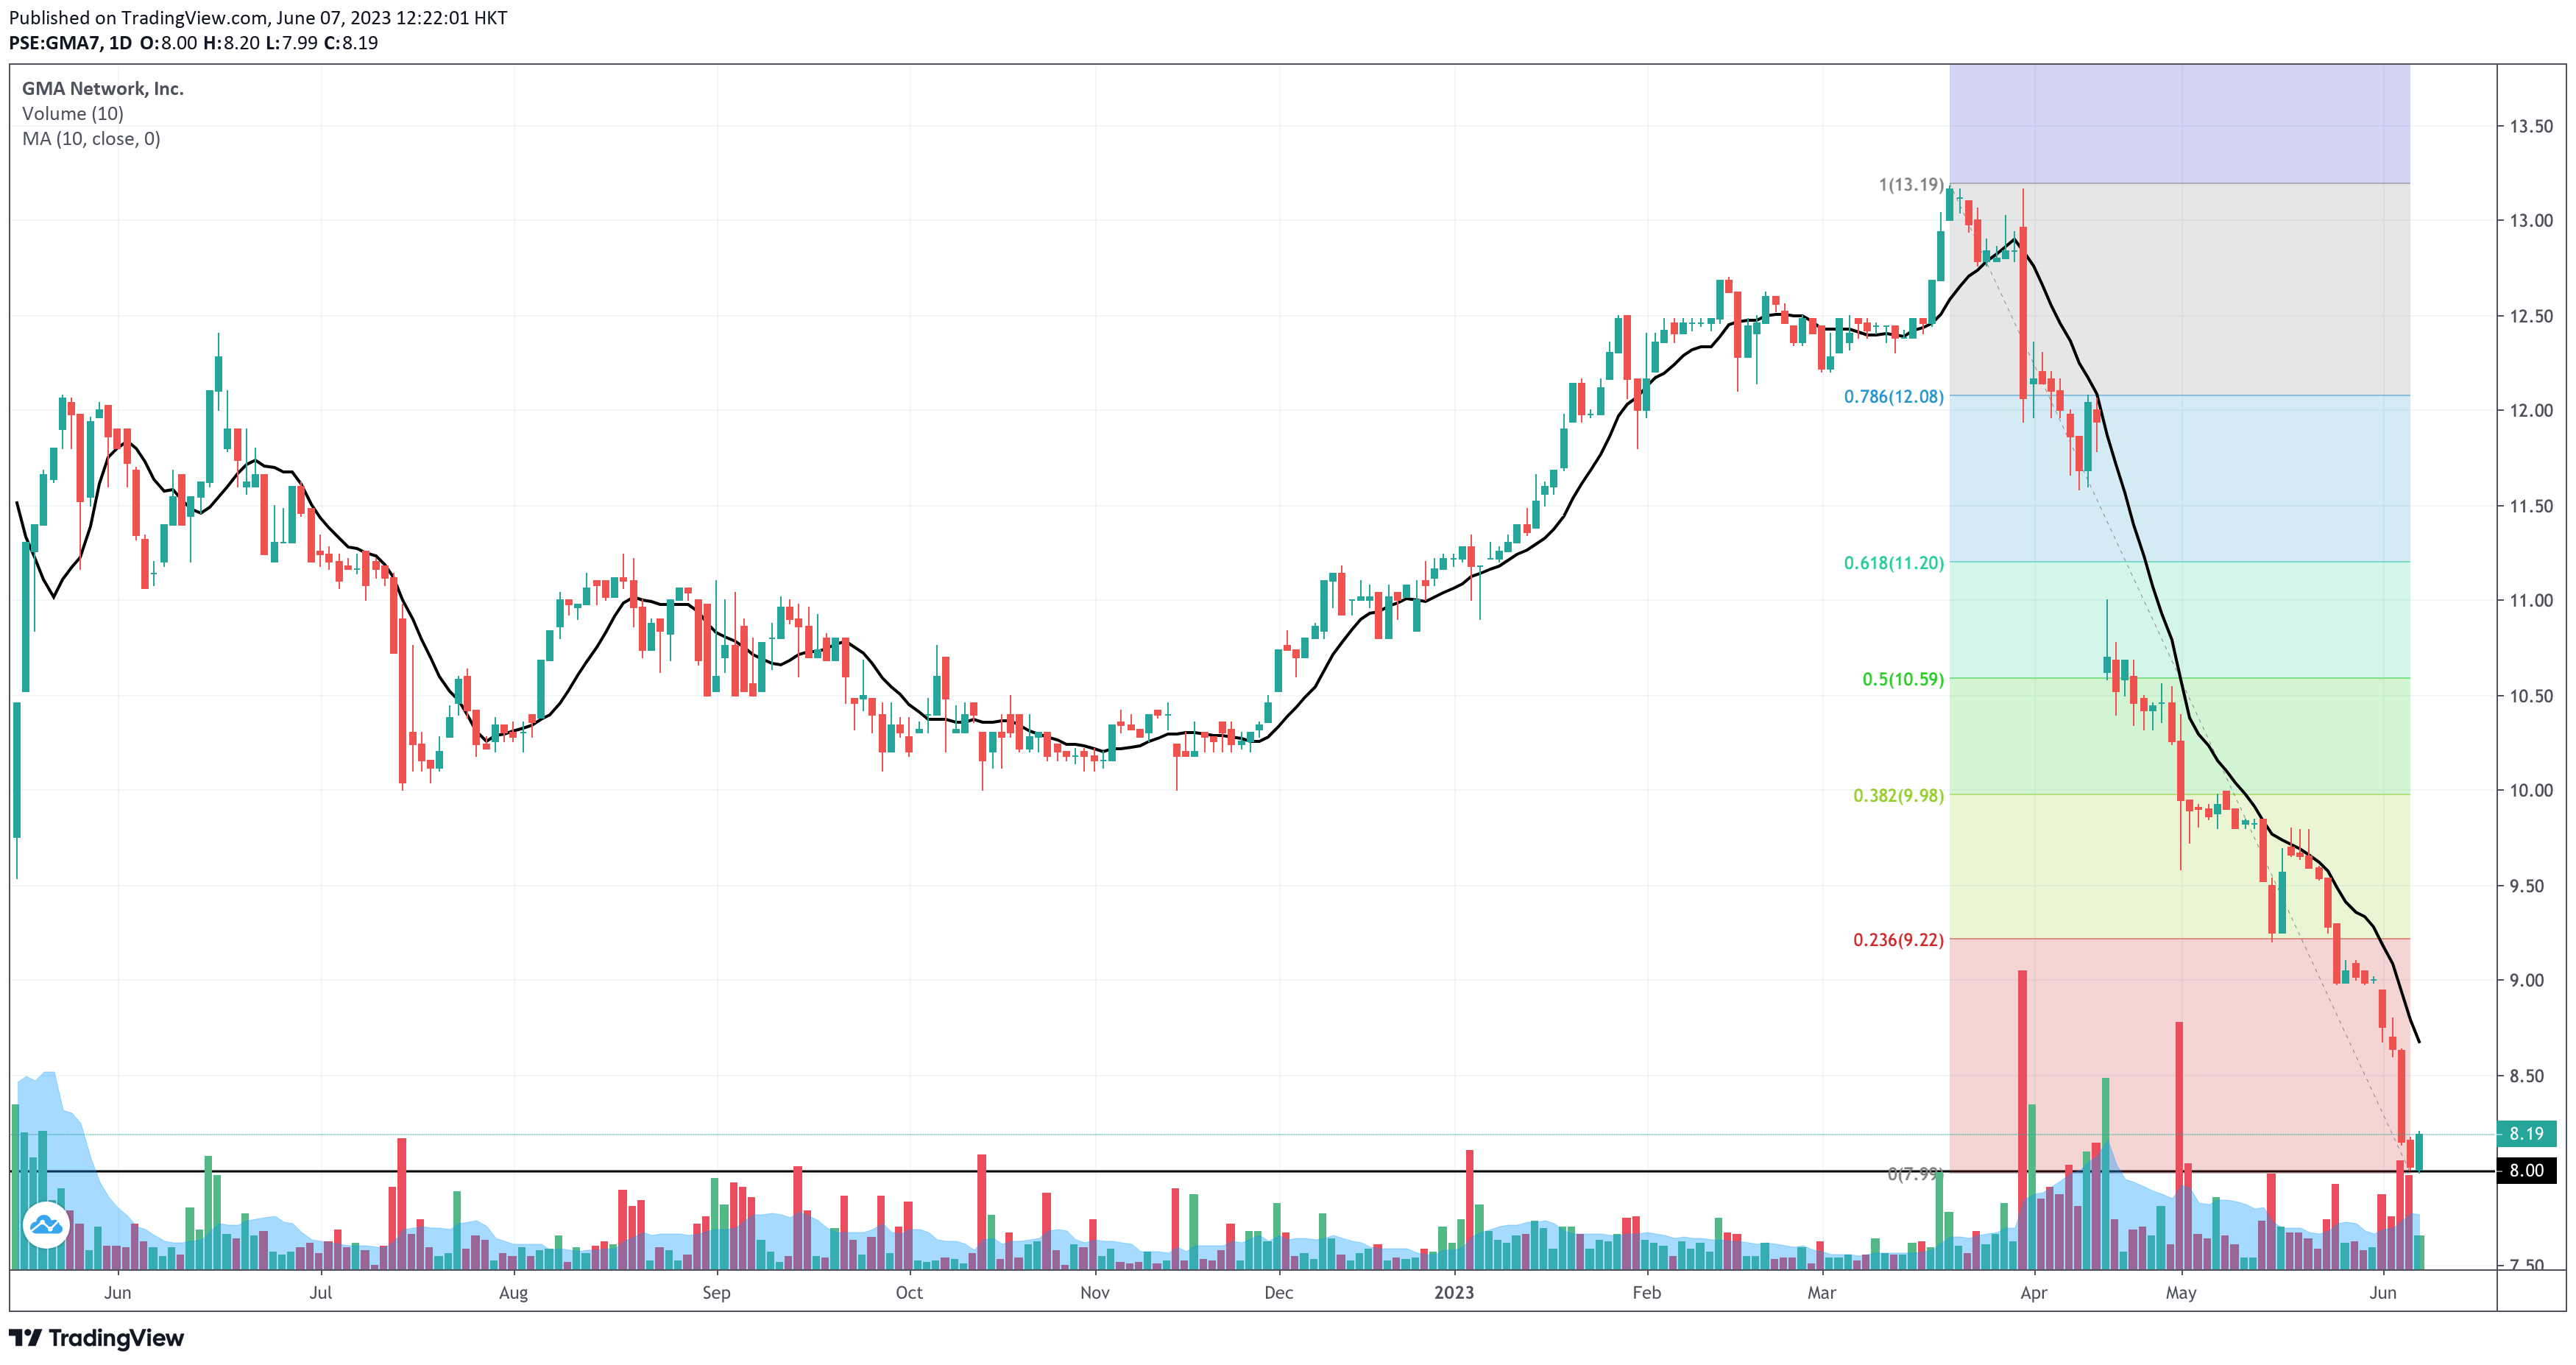
Has GMA7 found its support at P8.00, or do we see a dead cat bounce (DCB)?
As of recess on June 7, 2023, the media company closed at P8.19 per share, up by 2.12% but still down by 27% year-to-date.
If the hope planted in the first half of today’s trading won’t see the light of day once trading resumes, we might see the stock plummet further to P7.50 as a precursor to P6.70.
Resistance stands near P9.20, aligned with the 23.6% retracement of the Down Fibonacci, a precursor to the next resistance at P10.00, confluent to the 38.2% Fibonacci retracement.
The first half’s volume is over 50% of GMA7’s 10-day volume average. With that, I see a strand of hope regarding the potential continuity of the price’s ascent.
However, I need more than one data-driven basis to sustain that sentiment.
Let’s look at my trade-volume distribution and market sentiment analyses and see if we can get other data-driven “strands of hope”.
Trade and Volume Distribution Analysis
- Dominant Range Index: BEARISH
- Last Price: 8.19
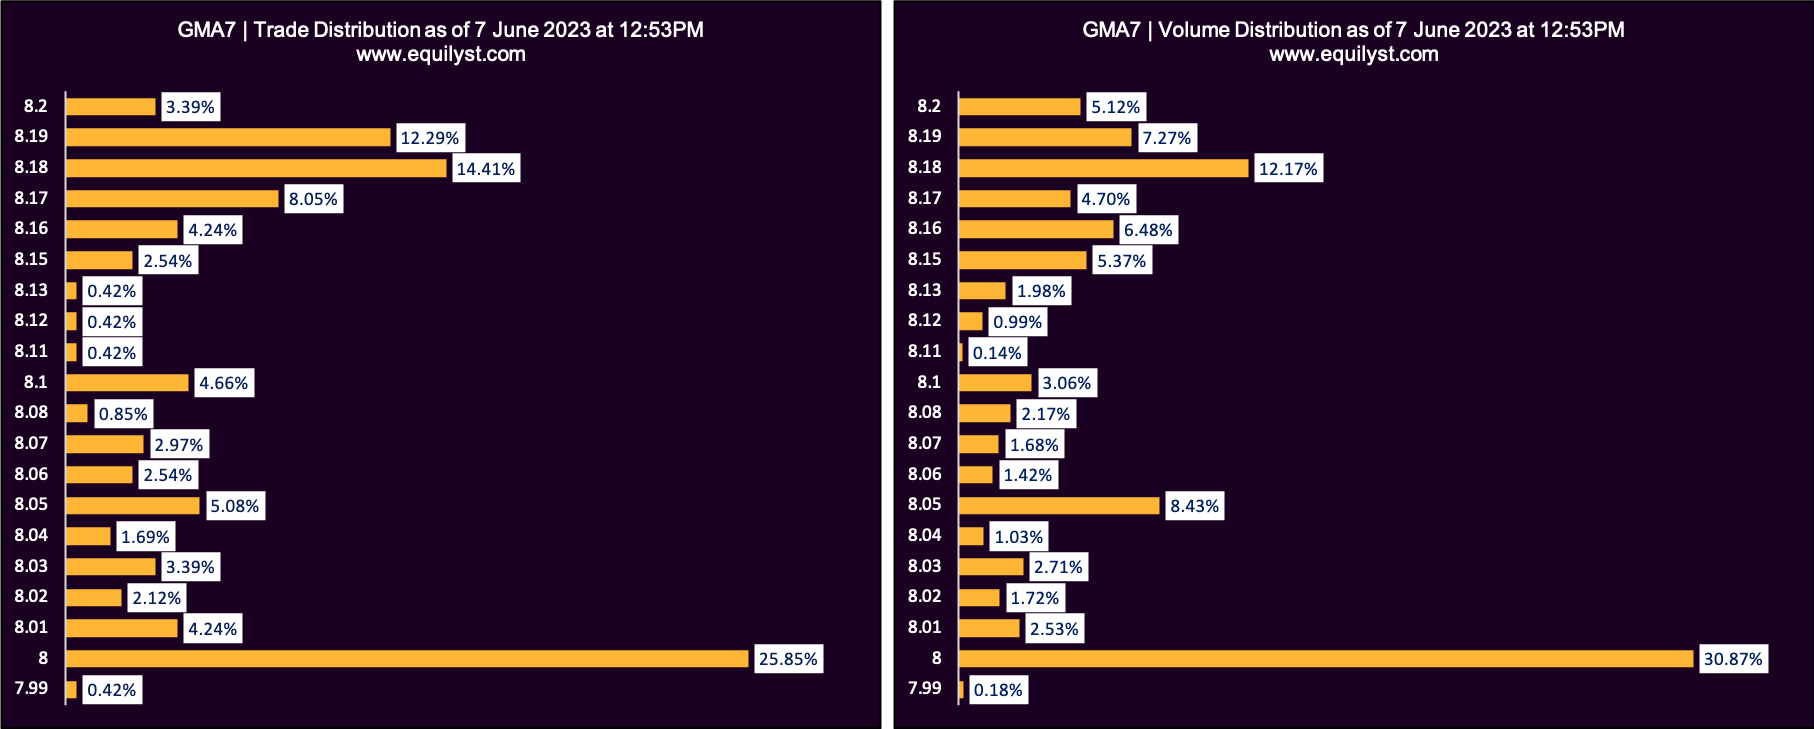
- VWAP: 8.09
- Dominant Range: 8 – 8
Unfortunately, my Dominant Range Index is stingy today. While the last price is higher than the volume-weighted average price, the price range with the biggest volume and highest number of trades is parked closer to the intraday low than the intraday high, leading to a bearish Dominant Range Index.
Market Sentiment Analysis – June 7, 2023
- Market Sentiment Index: BULLISH
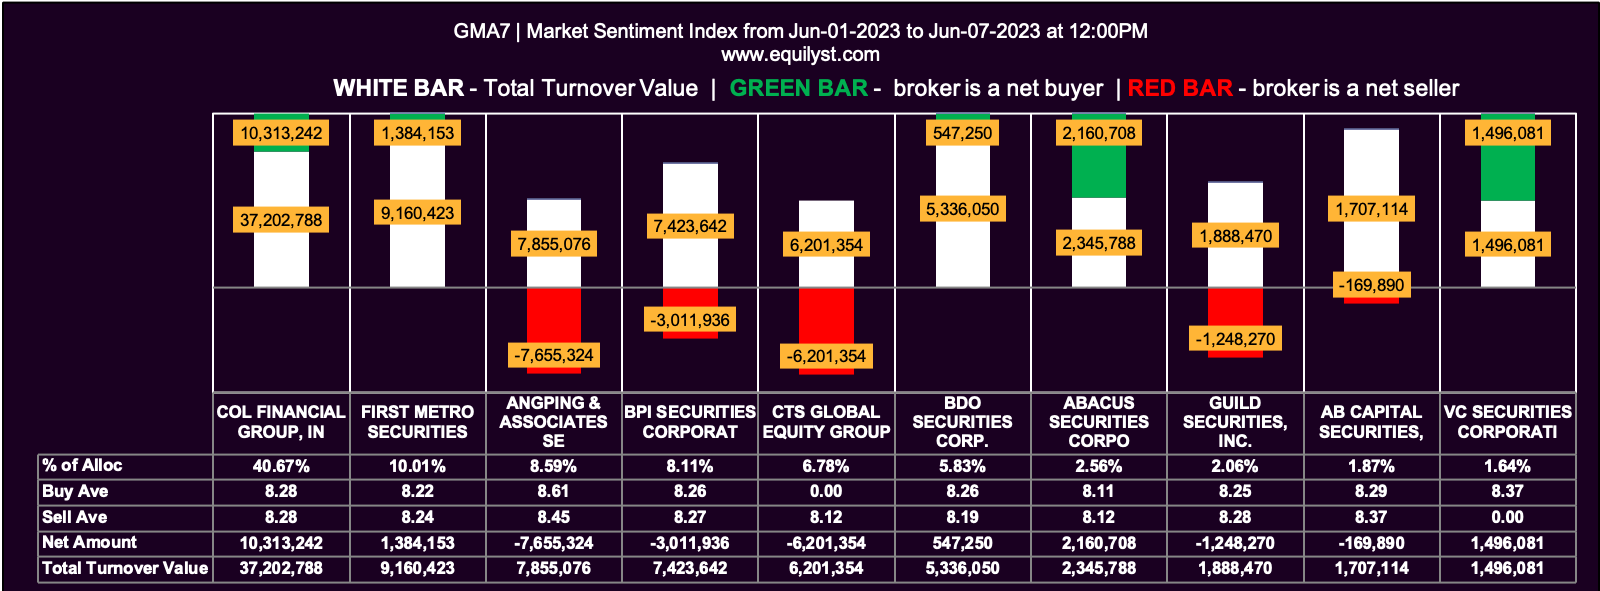
- 16 of the 25 participating brokers, or 64.00% of all participants, registered a positive Net Amount
- 18 of the 25 participating brokers, or 72.00% of all participants, registered a higher Buying Average than Selling Average
- 25 Participating Brokers’ Buying Average: ₱8.08479
- 25 Participating Brokers’ Selling Average: ₱8.10843
- 14 out of 25 participants, or 56.00% of all participants, registered a 100% BUYING activity
- 4 out of 25 participants, or 16.00% of all participants, registered a 100% SELLING activity
I see mixed sentiments on the statistics generated by my proprietary Market Sentiment Index indicator.
While more than 50% of the trade participants in the first half of trading registered a 100% buying activity, the overall selling average of the 25 participating brokers is higher than their overall buying average.
The overall market sentiment rating still managed to pen down a bullish rating due to the other bullish elements of my Market Sentiment Index indicator.
This tug-of-war of ratings between my Dominant Range Index and Market Sentiment Index hints at caution.
As the author of the Evergreen Strategy’s algorithm, I interpret this as a reminder to stay on the sidelines and wait and see.
What If You Already Have GMA7 Shares?
Does it mean you shouldn’t do anything even if you already have GMA7 shares in your portfolio?
Of course, not! You must check if your trailing stop is still intact. If the current price still trades above your trailing stop, you can emotionally and financially tolerate the price drop.
If your trailing stop is already above the current price, what are you waiting for?
Jose Mari Chan’s memes?
Activate the sleeping Risk Management 101 on the left side of your brain!
Market Sentiment Analysis – June 1-7, 2023
How’s the Overall Market Sentiment for June MTD?
- Market Sentiment Index: BULLISH
- 38 of the 54 participating brokers, or 70.37% of all participants, registered a positive Net Amount
- 33 of the 54 participating brokers, or 61.11% of all participants, registered a higher Buying Average than Selling Average
- 54 Participating Brokers’ Buying Average: ₱8.28485
- 54 Participating Brokers’ Selling Average: ₱8.33468
- 26 out of 54 participants, or 48.15% of all participants, registered a 100% BUYING activity
- 6 out of 54 participants, or 11.11% of all participants, registered a 100% SELLING activity
The MTD overall market sentiment agrees with the first half’s market sentiment rating.
So, as long as your trailing stop is intact and the overall market sentiment (MTD, WTD, or Daily) is bullish, you have a data-driven reason to hold your position.
Would I Buy More GMA7 Shares If I Had It?
I wouldn’t because not all six indicators of my Evergreen Strategy are bullish.
I will recheck the status of my six indicators once the price touches P8.70.
Would I Test-Buy Now?
Not yet. My Evergreen Strategy has yet to issue a confirmed buy signal.
What Would I Do If I Were Interested in Trading or Investing in GMA7?
I will monitor its daily total traded value.
Once it registers a total traded value of at least P20 million for three consecutive trading days, I consider adding it to my watchlist if there’s still an available slot.
I only maintain five slots in my watchlist.
Then, I will run my Evergreen Strategy’s algorithm on GMA7.
Once my algorithm issues a confirmed buy signal, I will compute my initial trailing stop and reward-to-risk ratio.
If I’m happy with the ratio, I will do a test buy within the prevailing dominant range.
That’s my process.
If you want to learn my entire methodology, check out my stock market consultancy service here.
- MA, BDO, ALI, URC, PX: Is Their Dominant Range Pointing to a Breakout? - March 14, 2025
- Tracking Market Sentiment: MTD Ratings for 30 Bluechip Stocks (March 2025) - March 13, 2025
- PSEi Stalls Below 6,260 as Market Awaits Political Shift - March 12, 2025


