Apollo Global Capital (APL) Technical Analysis
As of this report, Apollo Global Capital (APL) trades at P0.026 per share, down by 45.26% from its all-time high of P0.475 registered last January 20, 2021. Meanwhile, APL is down by 21.21% year-to-date.
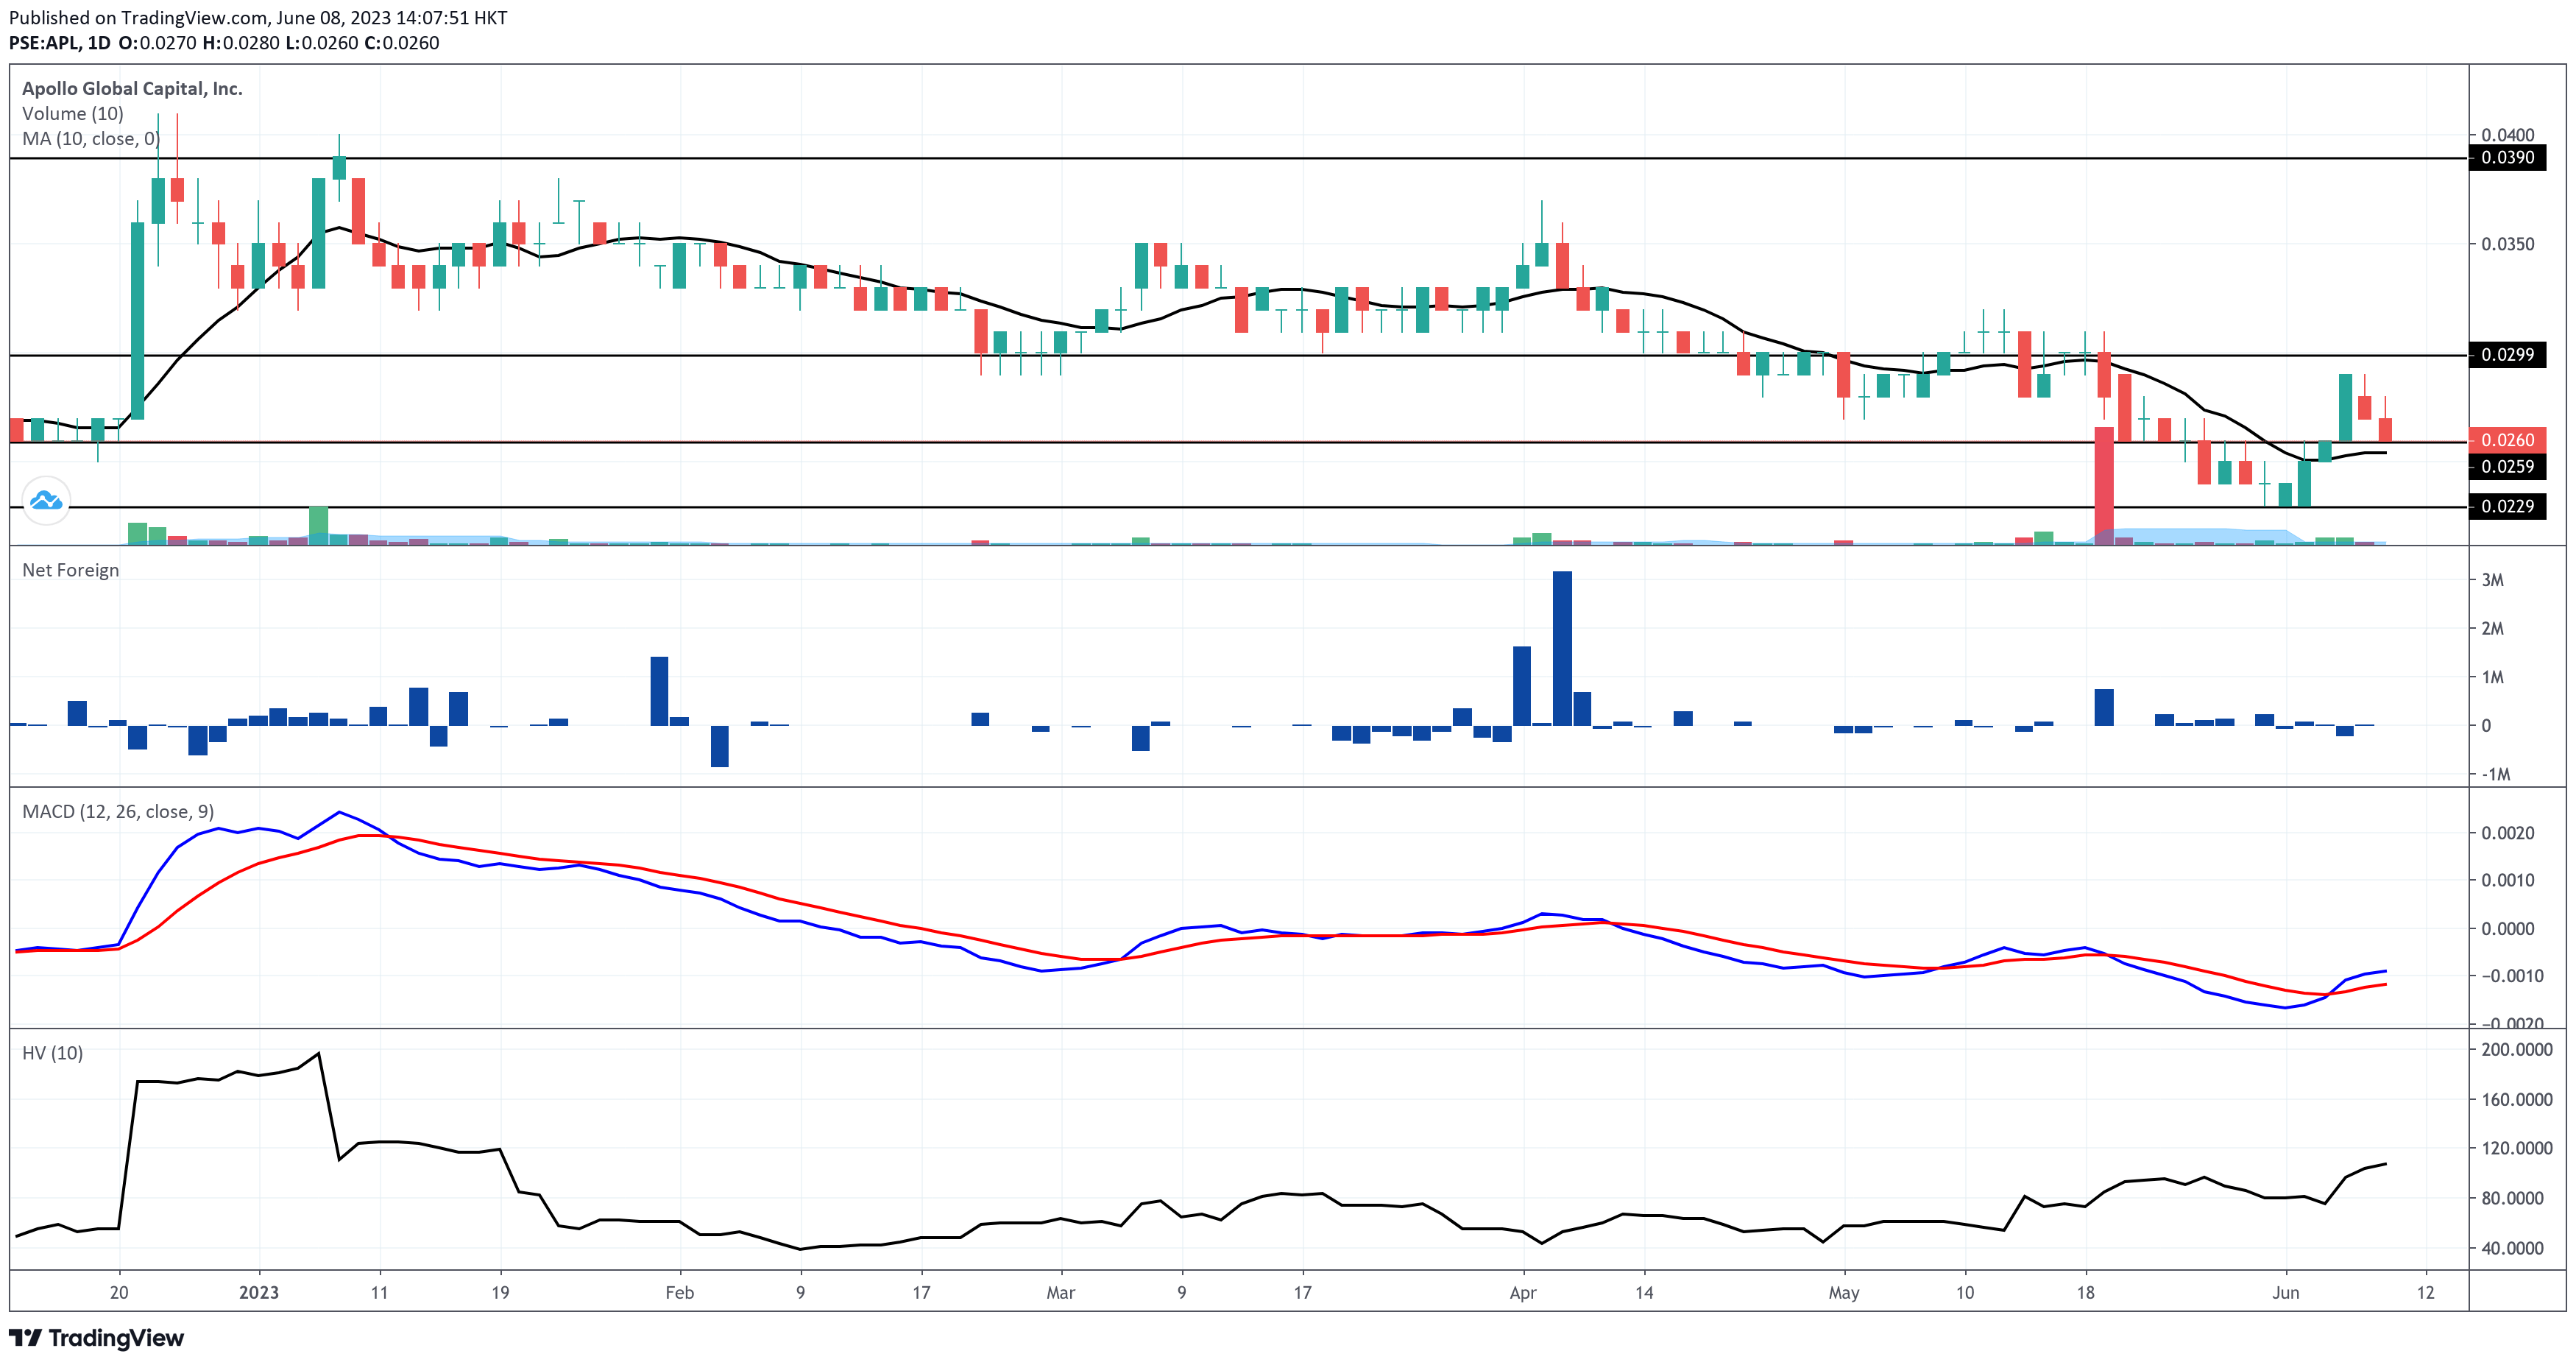
While APL trades above its 10-day simple moving average, it’s on the verge of breaking below its mid-term support at P0.026. If that happens, this stock will bring the possibility of retesting the support near P0.23.
If you still have APL, what you’re hoping to see here is for APL to break above the resistance at P0.023 with a volume higher than 100% of APL’s 10-day volume average to strengthen the possibility of moving closer to the higher resistance near P0.039.
It’s good to see that APL’s moving average convergence divergence (MACD) is bullish. I don’t see a formation of a bearish convergence between the MACD and the signal lines.
I cannot derive much sentiment from the foreign investors’ participation due to the insignificant Net Foreign amount they register on APL daily.
On the other hand, APL is no longer a newbie-friendly stock due to its high risk level based on its 10-day historical volatility score.
APL is prone to showing engulfing candlesticks. Newbie traders and investors are prone to making premature buying or selling decisions when they witness engulfing candlesticks.
Engulfing candlestick means a candlestick with a length (measured from wick to wick) taller than the previous trading day’s.
When a newbie trader sees a bearish engulfing candlestick, the tendency is to sell prematurely, thinking the stock will go down further, even if that trader’s trailing stop is still far from getting hit.
Also, a newbie trader tends to make an early buying decision when he sees a bullish engulfing candlestick, thinking that the stock will always move upward, even if the dominant range is already closer to the intraday low than the intraday high.
We can have more scenario-based discussions during our exclusive online training when you avail of the GOLD package of my stock market consultancy service.
Trade-Volume Analysis
Dominant Range Index: BULLISH
Last Price: 0.026
VWAP: 0.03
Dominant Range: 0.027 – 0.027
Even if my Dominant Range Index indicator issued a bullish rating, I see a problem here. The last price is less than the volume-weighted average price. My Evergreen Strategy requires that the current price is higher than the VWAP.
Market Sentiment Analysis
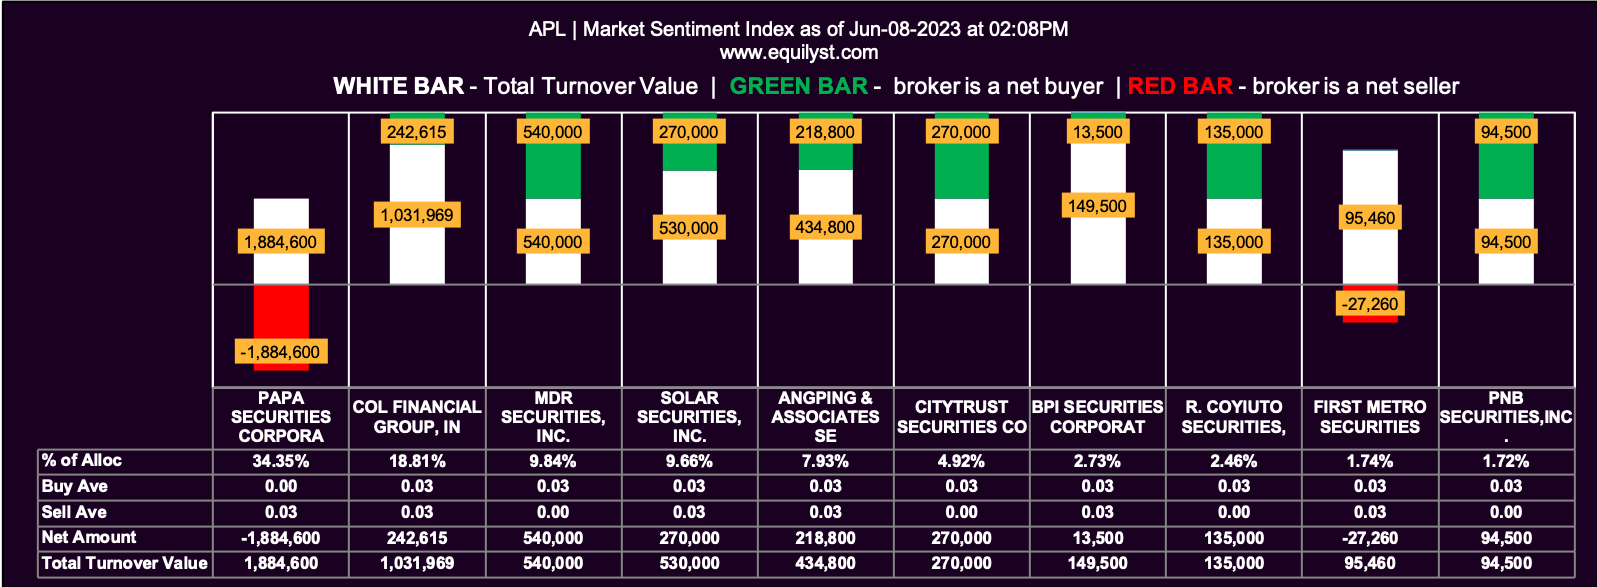
Market Sentiment Index: BULLISH
15 of the 21 participating brokers, or 71.43% of all participants, registered a positive Net Amount
13 of the 21 participating brokers, or 61.90% of all participants, registered a higher Buying Average than Selling Average
21 Participating Brokers’ Buying Average: ₱0.02673
21 Participating Brokers’ Selling Average: ₱0.02645
10 out of 21 participants, or 47.62% of all participants, registered a 100% BUYING activity
5 out of 21 participants, or 23.81% of all participants, registered a 100% SELLING activity
APL’s Market Sentiment Index is bullish, but how about the month-to-date sentiment? If you bought the SILVER package of my stock market consultancy service, you could use one of your Stock Analysis Request credits to know my complete analysis with a tailored fit recommendation relative to your entry price, number of shares, profit/loss percentage, and tolerable risk percentage, among others.
- MA, BDO, ALI, URC, PX: Is Their Dominant Range Pointing to a Breakout? - March 14, 2025
- Tracking Market Sentiment: MTD Ratings for 30 Bluechip Stocks (March 2025) - March 13, 2025
- PSEi Stalls Below 6,260 as Market Awaits Political Shift - March 12, 2025


