What’s Price-to-Book Value and the Ideal P/BV?
The price-to-book value is a financial metric that compares a company’s market price per share to its book value per share. It is calculated by dividing the market price per share by the book value per share.
What’s the ideal price-to-book value (P/BV)?
There’s no universal or ideal price-to-book value, but a P/BV less than 1 typically suggests that the market values the company lower than its accounting value, which could indicate an undervalued stock. Conversely, a P/BV greater than 1 suggests the market values the company higher than its accounting value.
With that said, I’ve managed to filter the five most undervalued property stocks listed in the Philippine Stock Exchange as of August 31, 2023.
In addition to ranking them, I’m also going to show you their month-to-date Market Sentiment Index and intraday Dominant Range Index so you’ll have a data-driven idea of the confidence level of market participants and the potential trajectory of each stock’s price.
5 Most Undervalued Property Stocks in the PSE Based on P/BV Less Than 1
Rank: 5
Stock Code: DD
Company Name: DoubleDragon Corporation
Price-to-Book Value: 0.387
Rank: 4
Stock Code: MEG
Company Name: Megaworld Corporation
Price-to-Book Value: 0.294
Rank: 3
Stock Code: CPG
Company Name: Century Properties Group, Inc.
Price-to-Book Value: 0.183
Rank: 2
Stock Code: FLI
Company Name: Filinvest Land, Inc.
Price-to-Book Value: 0.177
Rank: 1
Stock Code: VLL
Company Name: Vista Land & Lifescapes, Inc.
Price-to-Book Value: 0.172
Dominant Range of the 5 Most Undervalued Property Stocks
The dominant price range is either a standalone price or a range of prices with the highest volume and the greatest number of trades.
Let me respond to that question with more questions.
Imagine you’re on the verge of buying the stock. If the dominant price range is closer to the intraday low than the intraday high, will you rush into buying, or will you wait a bit longer because the price is likely to continue moving downward?
Now, consider you’re about to realize your gains, even though your trailing stop is still in place. If the dominant price range is closer to the intraday high than the intraday low, will you rush into selling, or will you wait a bit longer because the price is likely to continue moving upward?
Picture this: it’s been 60 minutes since the opening bell. If the current price is at the intraday high itself, but the dominant price range includes the intraday low, wouldn’t that make you question the sustainability of the intraday bullishness?
I’ve only presented you with three scenarios where understanding the location of the dominant price range is useful in decision-making. There’s a lot more we can discuss in my stock investment consultancy service. Learn about the requirements here.
Here’s the dominant range of each of the 5 most undervalued property stocks.
Undervalued Property Stock (per P/BV): DD
Company Name: DoubleDragon Corporation
Dominant Range Index: BULLISH
Last Price: 7.35
VWAP: 7.37
Dominant Range: 7.40 – 7.42
Undervalued Property Stock (per P/BV): MEG
Company Name: Megaworld Corporation
Dominant Range Index: BEARISH
Last Price: 2.00
VWAP: 2.00
Dominant Range: 2.00 – 2.01
Undervalued Property Stock (per P/BV): CPG
Company Name: Century Properties Group, Inc.
Dominant Range Index: BEARISH
Last Price: 0.345
VWAP: 0.34
Dominant Range: 0.34 – 0.34
Undervalued Property Stock (per P/BV): FLI
Company Name: Filinvest Land, Inc.
Dominant Range Index: BEARISH
Last Price: 0.65
VWAP: 0.66
Dominant Range: 0.65 – 0.66
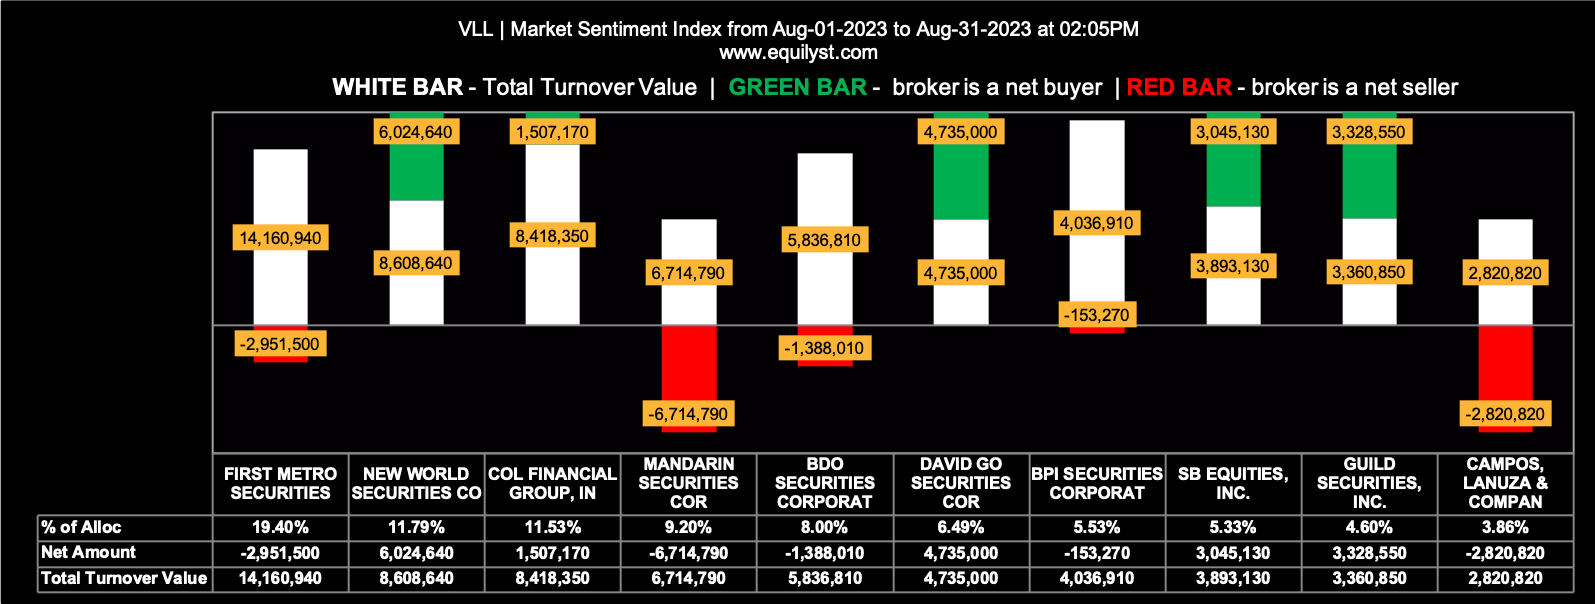
Undervalued Property Stock (per P/BV): VLL
Company Name: Vista Land & Lifescapes, Inc.
Dominant Range Index: BULLISH
Last Price: 1.59
VWAP: 1.60
Dominant Range: 1.59 – 1.60
MTD Market Sentiment for the 5 Most Undervalued Property Stocks
How do you gauge the market sentiment?
By running a survey or observing discussions on stock market-related Facebook Groups?
But how do you verify the integrity or objectivity of their comments? That’s the problem!
Occasionally, I run surveys on Facebook Groups, but not to check the market sentiment but to ask them which stock they’d like me to write about in my next article. That way, I maintain the objectivity of my stock selection process as far as when deciding which stock to feature in my articles.
I check the overall market sentiment rating of a stock to help me decide whether I should hold my position since my trailing stop is still intact or pre-empt it.
The market sentiment also helps me estimate if the prevailing direction of the share price is likely to continue or reverse.
For example, if the stock is in a downtrend and the prevailing market sentiment is bearish, it means the downtrend is likely to continue.
If the stock is in a downtrend, but the market sentiment turns bullish, it’s a sign that investors might see a bullish reversal.
Again, and again, notice the adverbs I’m using – “likely” and “might”. We’re still talking about probabilities and not certainties.
Still, it’s better to be data-driven and be proven wrong by the market than make decisions based on gut feeling alone. The former gives you the opportunity to optimize something while the latter doesn’t.
I have an extensive explanation about why I created my proprietary Market Sentiment Index indicator in some articles on my website. Use the SEARCH box on this website and type “Market Sentiment” to read my other articles where I talked about this subject.
Here’s the month-to-date market sentiment index of each of the 5 most undervalued property stocks.
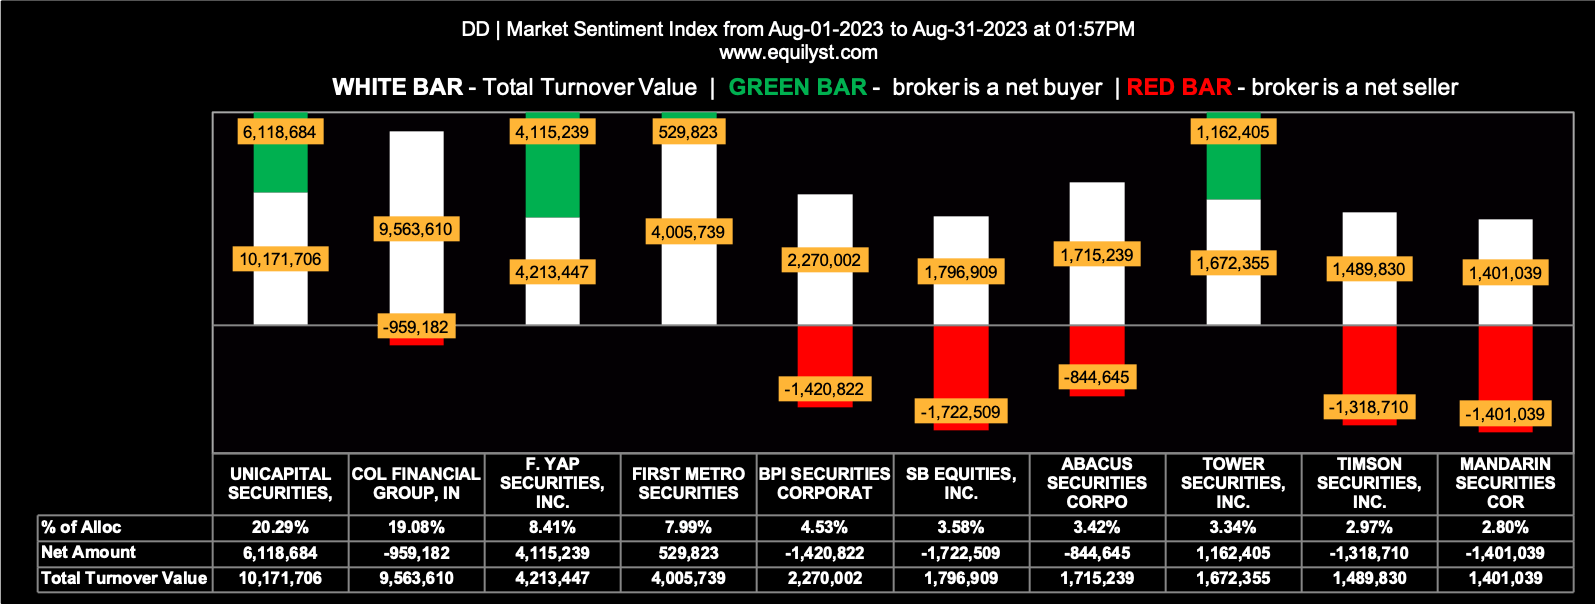
Undervalued Property Stock (per P/BV): DD
Company Name: DoubleDragon Corporation
Market Sentiment Index: BEARISH
13 of the 42 participating brokers, or 30.95% of all participants, registered a positive Net Amount
11 of the 42 participating brokers, or 26.19% of all participants, registered a higher Buying Average than Selling Average
42 Participating Brokers’ Buying Average: ₱7.66078
42 Participating Brokers’ Selling Average: ₱7.70164
1 out of 42 participants, or 2.38% of all participants, registered a 100% BUYING activity
15 out of 42 participants, or 35.71% of all participants, registered a 100% SELLING activity
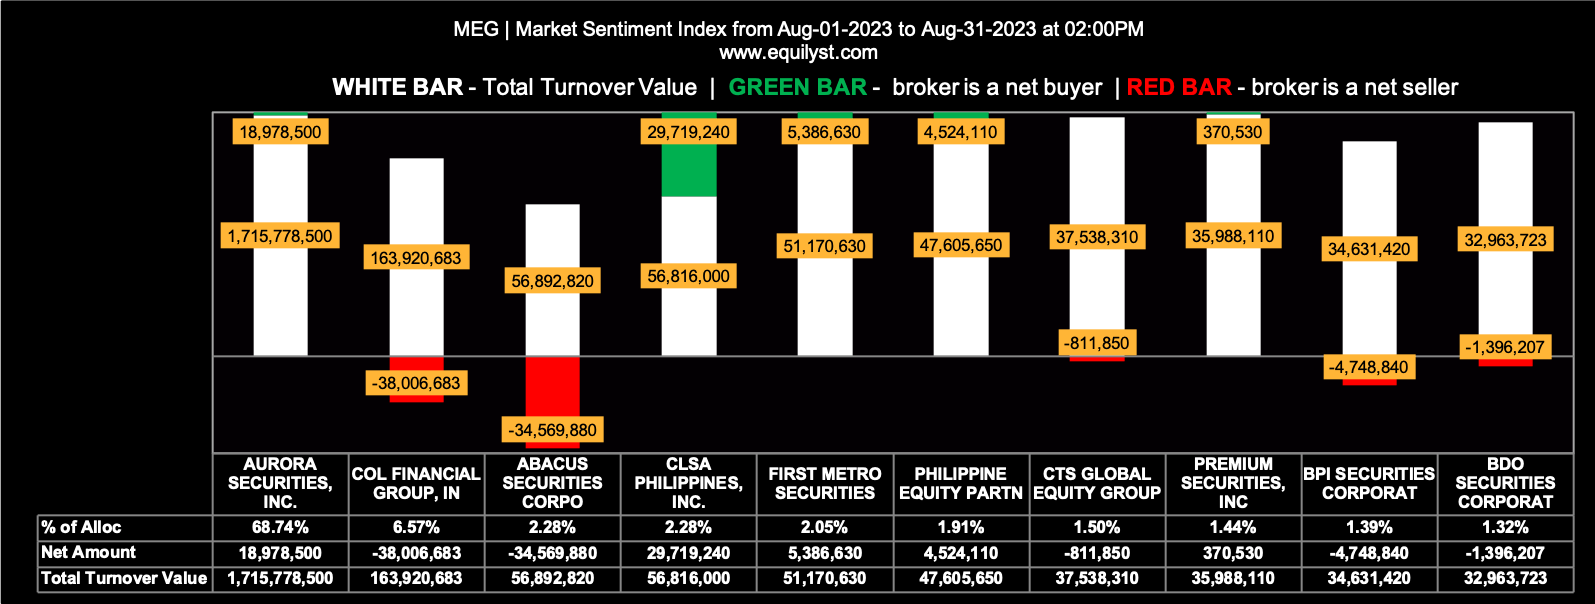
Undervalued Property Stock (per P/BV): MEG
Company Name: Megaworld Corporation
Market Sentiment Index: BEARISH
41 of the 89 participating brokers, or 46.07% of all participants, registered a positive Net Amount
38 of the 89 participating brokers, or 42.70% of all participants, registered a higher Buying Average than Selling Average
89 Participating Brokers’ Buying Average: ₱2.04140
89 Participating Brokers’ Selling Average: ₱2.05238
13 out of 89 participants, or 14.61% of all participants, registered a 100% BUYING activity
15 out of 89 participants, or 16.85% of all participants, registered a 100% SELLING activity
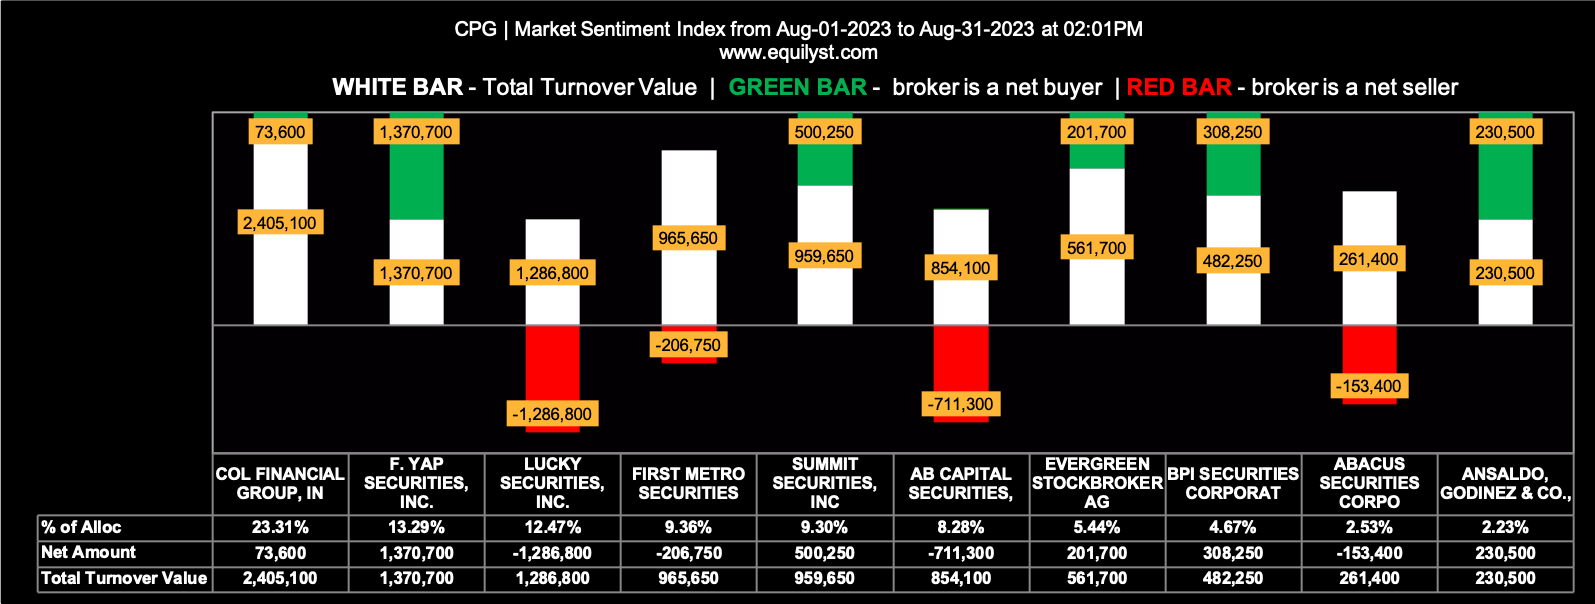
Undervalued Property Stock (per P/BV): CPG
Company Name: Century Properties Group, Inc.
Market Sentiment Index: BEARISH
11 of the 26 participating brokers, or 42.31% of all participants, registered a positive Net Amount
7 of the 26 participating brokers, or 26.92% of all participants, registered a higher Buying Average than Selling Average
26 Participating Brokers’ Buying Average: ₱0.34199
26 Participating Brokers’ Selling Average: ₱0.34455
4 out of 26 participants, or 15.38% of all participants, registered a 100% BUYING activity
10 out of 26 participants, or 38.46% of all participants, registered a 100% SELLING activity
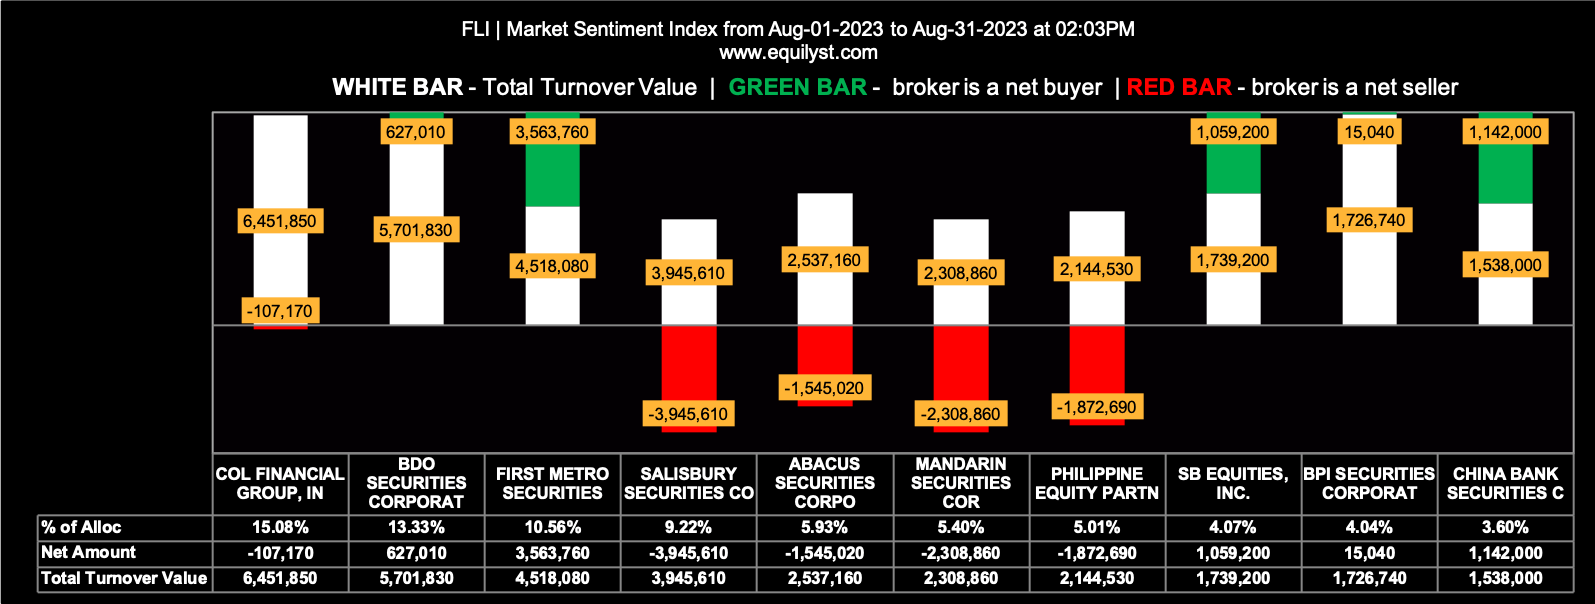
Undervalued Property Stock (per P/BV): FLI
Company Name: Filinvest Land, Inc.
Market Sentiment Index: BEARISH
24 of the 43 participating brokers, or 55.81% of all participants, registered a positive Net Amount
21 of the 43 participating brokers, or 48.84% of all participants, registered a higher Buying Average than Selling Average
43 Participating Brokers’ Buying Average: ₱0.66467
43 Participating Brokers’ Selling Average: ₱0.66784
13 out of 43 participants, or 30.23% of all participants, registered a 100% BUYING activity
14 out of 43 participants, or 32.56% of all participants, registered a 100% SELLING activity
Undervalued Property Stock (per P/BV): VLL
Company Name: Vista Land & Lifescapes, Inc.
Market Sentiment Index: BEARISH
12 of the 32 participating brokers, or 37.50% of all participants, registered a positive Net Amount
13 of the 32 participating brokers, or 40.63% of all participants, registered a higher Buying Average than Selling Average
32 Participating Brokers’ Buying Average: ₱1.57535
32 Participating Brokers’ Selling Average: ₱1.58299
5 out of 32 participants, or 15.63% of all participants, registered a 100% BUYING activity
11 out of 32 participants, or 34.38% of all participants, registered a 100% SELLING activity
Which Among the 5 Undervalued Property Stocks Will You Buy?
I’ve presented to you some pieces of information vital in making a data-driven stock investment decision. After synthesizing this stuff with your methodology relative to your risk tolerance, which one will you buy and why? Let me know in the comments below.
Are you looking to hire a crypto or stock investment consultant? Complete this form to avail yourself of my crypto and stock market consulting service.
Are you looking to hire a content writer for your crypto and stock investment website? Here’s the form you need to fill out.
- MA, BDO, ALI, URC, PX: Is Their Dominant Range Pointing to a Breakout? - March 14, 2025
- Tracking Market Sentiment: MTD Ratings for 30 Bluechip Stocks (March 2025) - March 13, 2025
- PSEi Stalls Below 6,260 as Market Awaits Political Shift - March 12, 2025




What can you say about INFRA whose book value is 22.97 cpmpared to its price of just 0.59?
By classical interpretation, that INFRA company is expensive relative to its P/BV of 22.97.
Does it mean I won’t buy it just because it’s expensive P/BV-wise?
Insofar as my proprietary methodology when buying or selling stocks is concerned, I don’t look at the financial ratios of the company anymore. Fundamental analysis don’t have fangs in a low volume market, like ours, relative to its peers in Asia, especially among first-world markets, such as the US stock market.
For one, the overall sentiment of PSE Index stocks remains at the mercy of the participation of foreign investors. We have a lackluster market because the hot money doesn’t find our market attractive. Retail traders can only do so much with their loose change.
So, if my proprietary methodology gives me a buy signal for a stock, whether it’s the most expensive stock or not according to any PE multiples, I’ll still calculate my reward-to-risk ratio. If I’m happy with the RRR, I’ll do a test-buy at or within the prevailing dominant range of the stock.