Int’l Container Terminal Services (ICT) Sentimental and Technical Analysis
I am writing this technical and sentimental analysis for Int’l Container Terminal Services (ICT) to tell you if I’m seeing a confirmed buy signal or not based on my Evergreen Strategy.
Six criteria must get a bullish rating for me to say that a stock has a confirmed buy signal.
If a confirmed buy signal is issued, that’s the only time I’ll compute my initial trailing stop and reward-to-risk ratio.
If I’m satisfied with the reward-to-risk ratio, I’ll buy within the prevailing dominant range of the stock.
I need to check my reward-to-risk ratio because I want to make sure that I’m vying for a bigger potential profit than my potential loss.
I cannot compute my reward-to-risk ratio unless I compute my initial trailing stop.
As you can see, I already know where to exit even before the stock reaches my portfolio. That’s risk management 101.
Here are the 6 criteria I am talking about.
- The last price must be higher than the 10-day simple moving average.
- The last price must be higher than the volume-weighted average price.
- The last volume must be above 50% of the 10-day average.
- The moving average convergence divergence (MACD) must be higher than the signal line.
- The Dominant Range Index must be bullish.
- The Market Sentiment Index must be bullish.
I’ll check one by one.
Last Price vs 10-day SMA
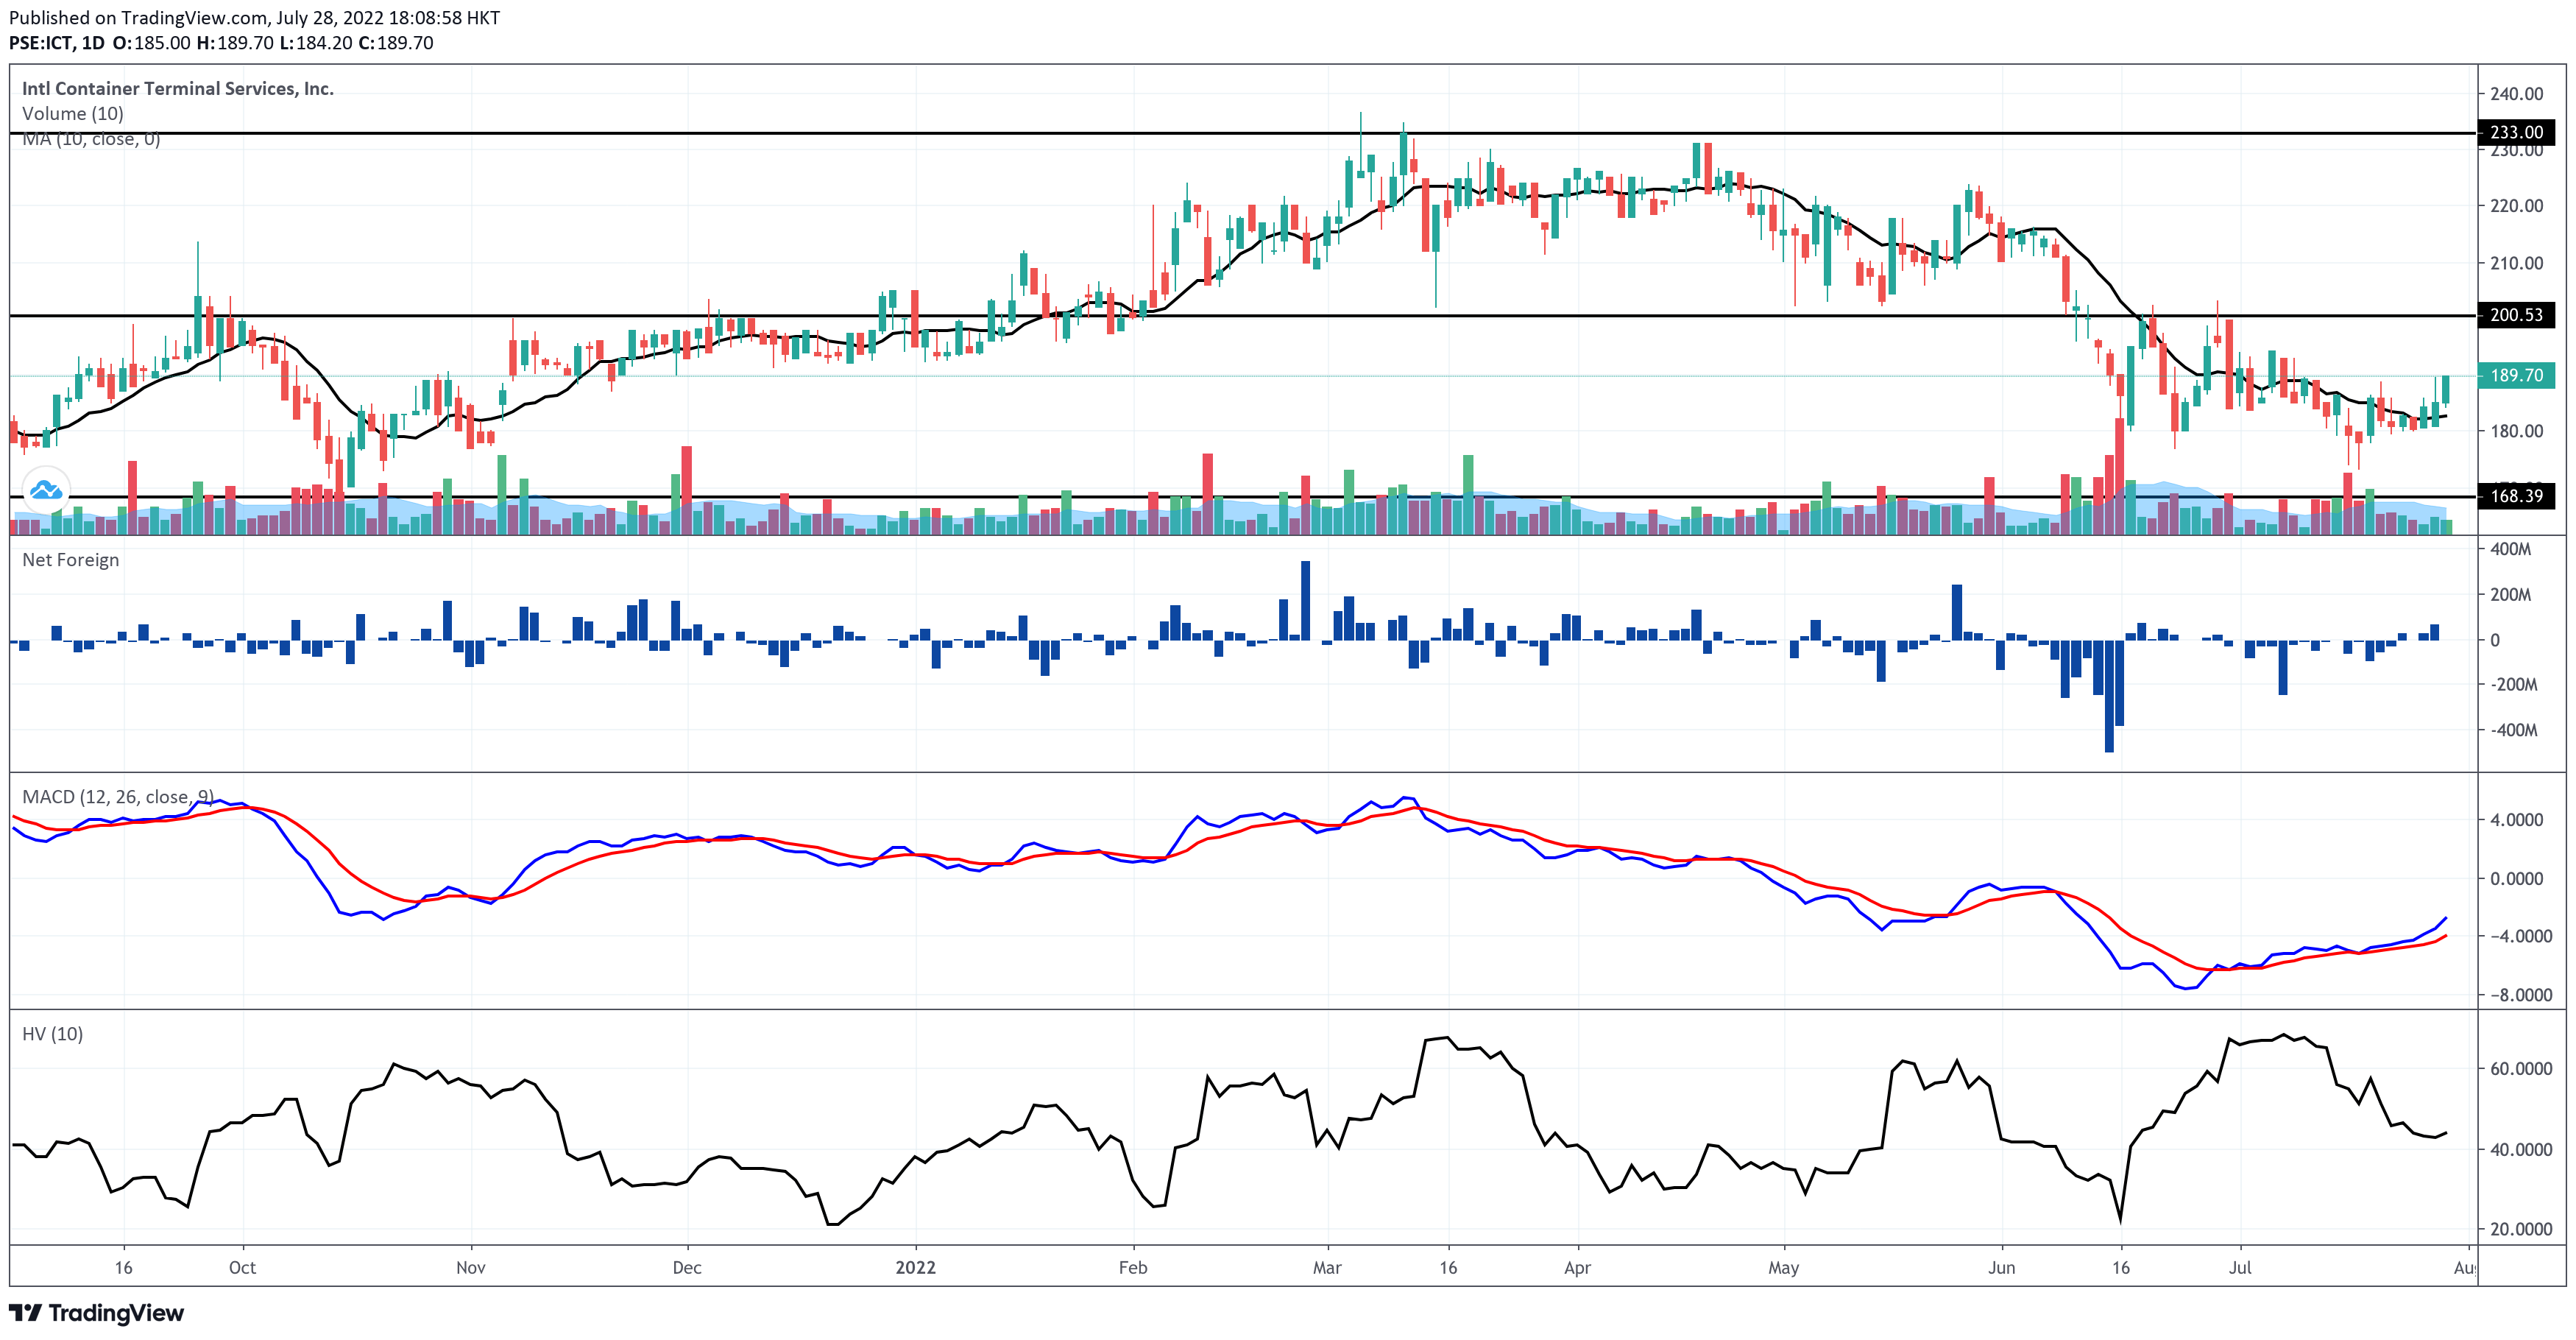
It’s been 3 trading days that ICT has been trading above its 10-day simple moving average (SMA).
The first criterion is bullish.
The immediate support is at P168.40, while the resistance is near P200.50.
You can see the support and resistance levels on the Daily Chart below.
 Last Price vs VWAP
The last price of P189.70 is higher than the volume-weighted average price (VWAP) of P187.36.
The second criterion is bullish.
Present Volume vs 10-day Volume Average
Today’s volume is at 820.79K shares.
The 10-day volume average is at 1.423M shares.
The 50% of 1.423M shares is 711.5K shares.
So, today’s volume is higher than 50% of the 10-day volume average.
The third criterion is bullish.
MACD vs. Signal Line
Today’s moving average convergence divergence (MACD) line is higher than the position of the signal line.
The fourth criterion is bullish.
Dominant Range Index
 Dominant Range Index: BULLISH
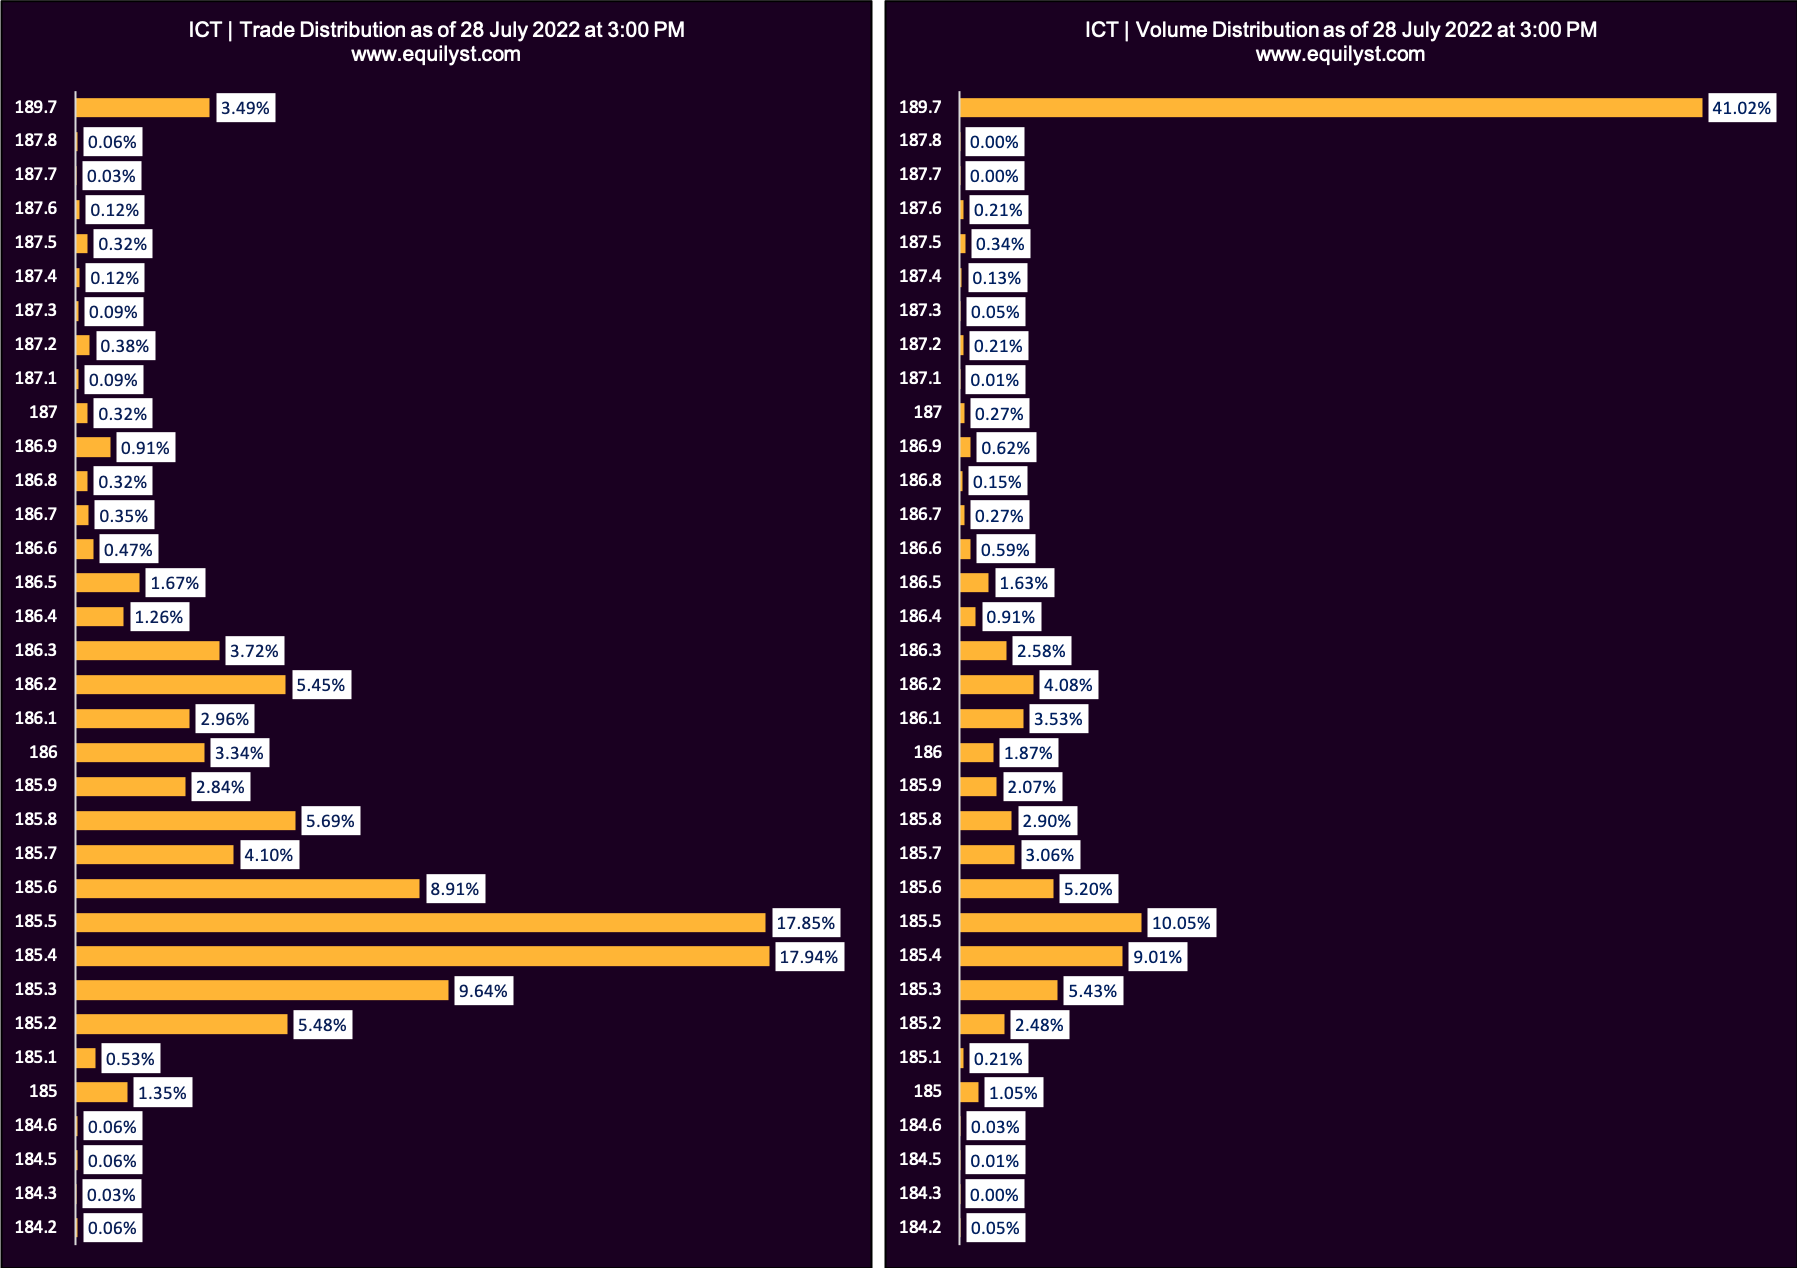
Last Price: 189.7
VWAP: 187.36
Dominant Range: 185.4 – 189.7
Market Sentiment Index
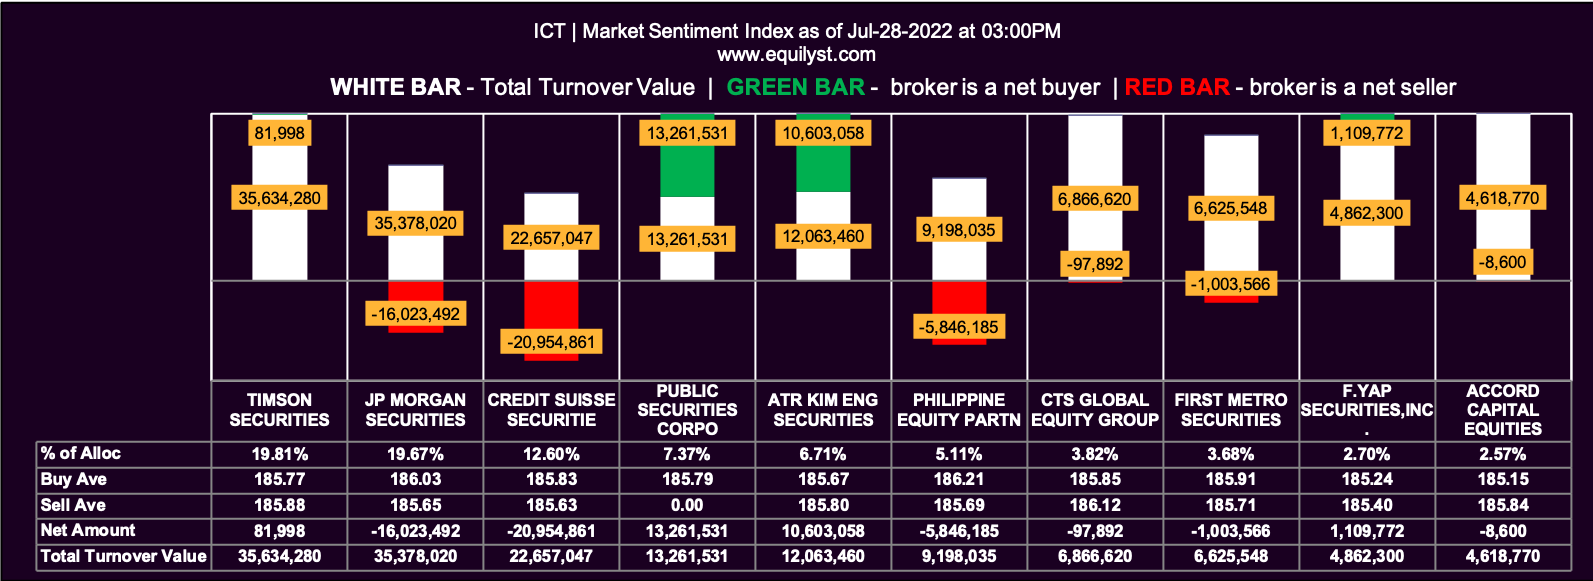
 Market Sentiment Index: BULLISH
17 of the 34 participating brokers, or 50.00% of all participants, registered a positive Net Amount
13 of the 34 participating brokers, or 38.24% of all participants, registered a higher Buying Average than Selling Average
34 Participating Brokers’ Buying Average: ₱185.68320
34 Participating Brokers’ Selling Average: ₱186.04288
9 out of 34 participants, or 26.47% of all participants, registered a 100% BUYING activity
7 out of 34 participants, or 20.59% of all participants, registered a 100% SELLING activity
Is There a Confirmed Buy Signal?
There is. All 6 criteria are bullish.
Does it mean I’ll buy by the next trading day?
Not necessarily.
Why?
What did I say in my introduction? Once a confirmed buy signal is spotted, I’ll have to compute my reward-to-risk ratio. If, and only if, I’m satisfied with the reward-to-risk ratio, will I buy within the prevailing dominant range.
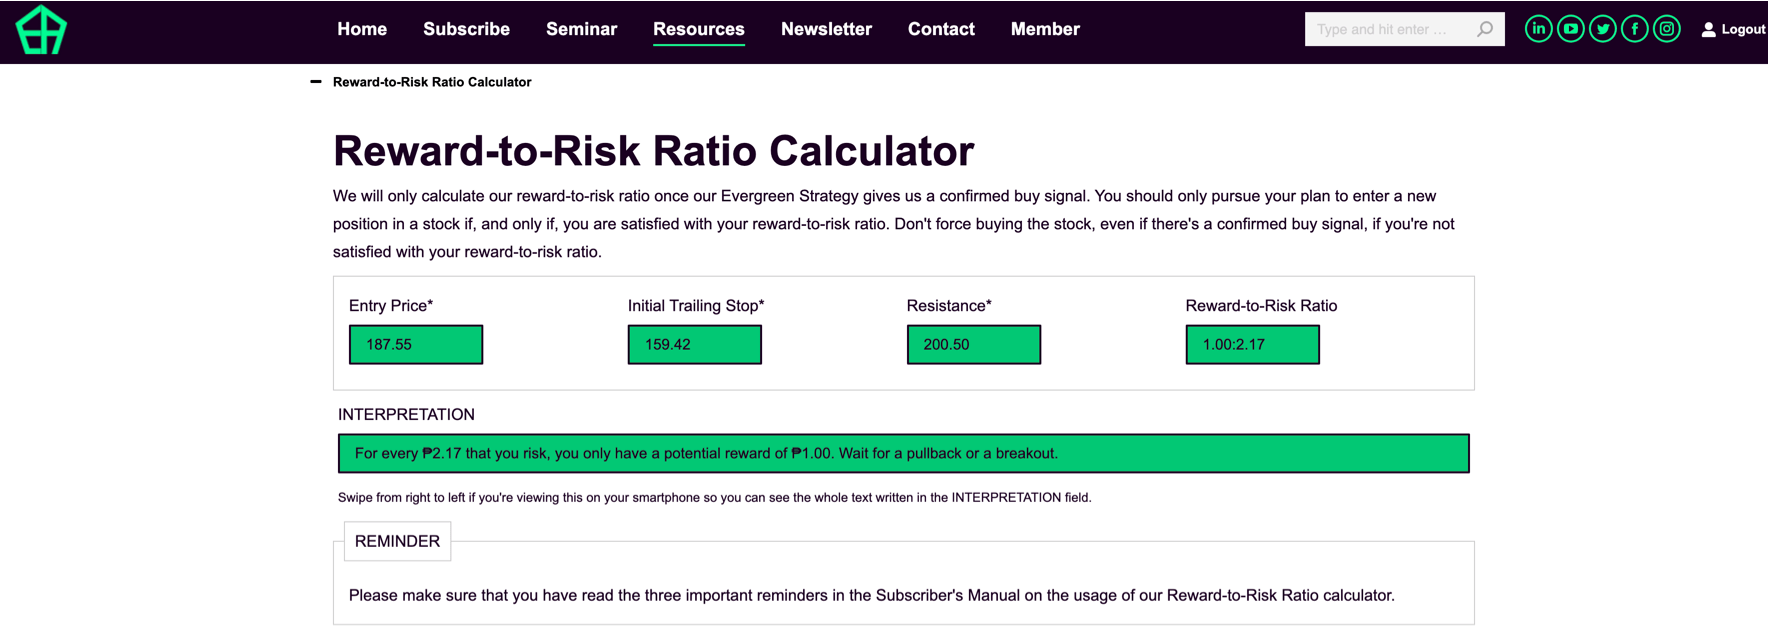
The dominant range is between P185.40 and P189.70. Their media is P187.55.
Suppose my entry price is P187.55, and my initial trailing stop is 85% below my entry price.
My initial trailing stop then is P159.42.
The resistance is at P200.50.
Given all these numbers, my reward-to-risk ratio then is P1.00:P2.17.
For every ₱2.17 that I risk, I only have a potential reward of ₱1.00.
It’s more prudent for me to wait for a pullback or a breakout.
I want you to understand that everyone’s satisfaction level on a reward-to-risk ratio is different. If you’re content with the ratio I computed above, it’s up to you to buy. Every decision in stock trading and investing must be personal.
We can follow the same methodology, but we will not have the same risk tolerance, financial goal, and investment horizon.
Once a pullback is spotted near the support or a breakout from the resistance, I will have to re-check if all 6 criteria are still bullish.
If they’re all bullish, I will re-compute my reward-to-risk ratio.
If I’m happy with the ratio, I will buy. If not, I will wait.
If I already have a position in ICT, I will hold my position, but I won’t top up yet.
Simple.
I have a reward-to-risk ratio calculator on my website. You can access it from the RESOURCES menu of my website. See the image below.
Would You Like Me to Teach You My Strategy in Person?
Would you like me to personally teach you my strategy from the very start? Subscribe to my stock market consultancy service so you’ll get a ticket to my whole-day workshop, or you can buy a ticket to my Evergreen Strategy seminar as an ala carte service.
- MA, BDO, ALI, URC, PX: Is Their Dominant Range Pointing to a Breakout? - March 14, 2025
- Tracking Market Sentiment: MTD Ratings for 30 Bluechip Stocks (March 2025) - March 13, 2025
- PSEi Stalls Below 6,260 as Market Awaits Political Shift - March 12, 2025


