How and Why Do I Do Trade-Volume Analysis
Trade and volume analysis helps me determine optimal price levels for buying and selling securities. At Equilyst Analytics, I use a specific approach known as Dominant Range analysis, which focuses on two key aspects: trades and volume.
When conducting trade and volume analysis, I assess the position of the volume-weighted average price (VWAP) in relation to the current price. Additionally, I consider the position of the dominant range relative to the intraday high and low.
The dominant range refers to the price range characterized by the highest trading volume and the greatest number of trades. By examining the proximity of the dominant range to the intraday high and low, I gain insights into the interest of participating traders and investors in pushing the price higher.
To gauge the level of optimism among participants regarding buying the stock at a higher price, I analyze whether the current price exceeds the VWAP or if the VWAP falls within the dominant range, particularly closer to the intraday high than the intraday low.
Achieving a sense of balance or equilibrium between the number of trades and volume at each price level is essential. This equilibrium is evaluated in relation to the individual distribution of trades and volume within each group.
The culmination of this analysis is the development of my proprietary Dominant Range Index, which encapsulates the statuses of the elements I have encoded. By leveraging my algorithm’s processing capabilities, the Dominant Range Index can yield a bullish or bearish rating.
As the fifth component of my 6-indicator Evergreen Strategy When Trading and Investing in the Philippine Stock Market, the Dominant Range Index applies the Nash Equilibrium effect, a theory that holds considerable value in my capacity as a computer scientist and professional stock market analyst.
While the technical description of this functionality may seem intricate, I have simplified it by assigning an overall bullish or bearish rating to the Dominant Range analysis. A bullish rating implies an upward price movement is likely, while a bearish rating indicates the opposite.
In this complimentary report, I am pleased to share the Dominant Range Index for the following stocks, along with the respective date and time stamps displayed on their charts.
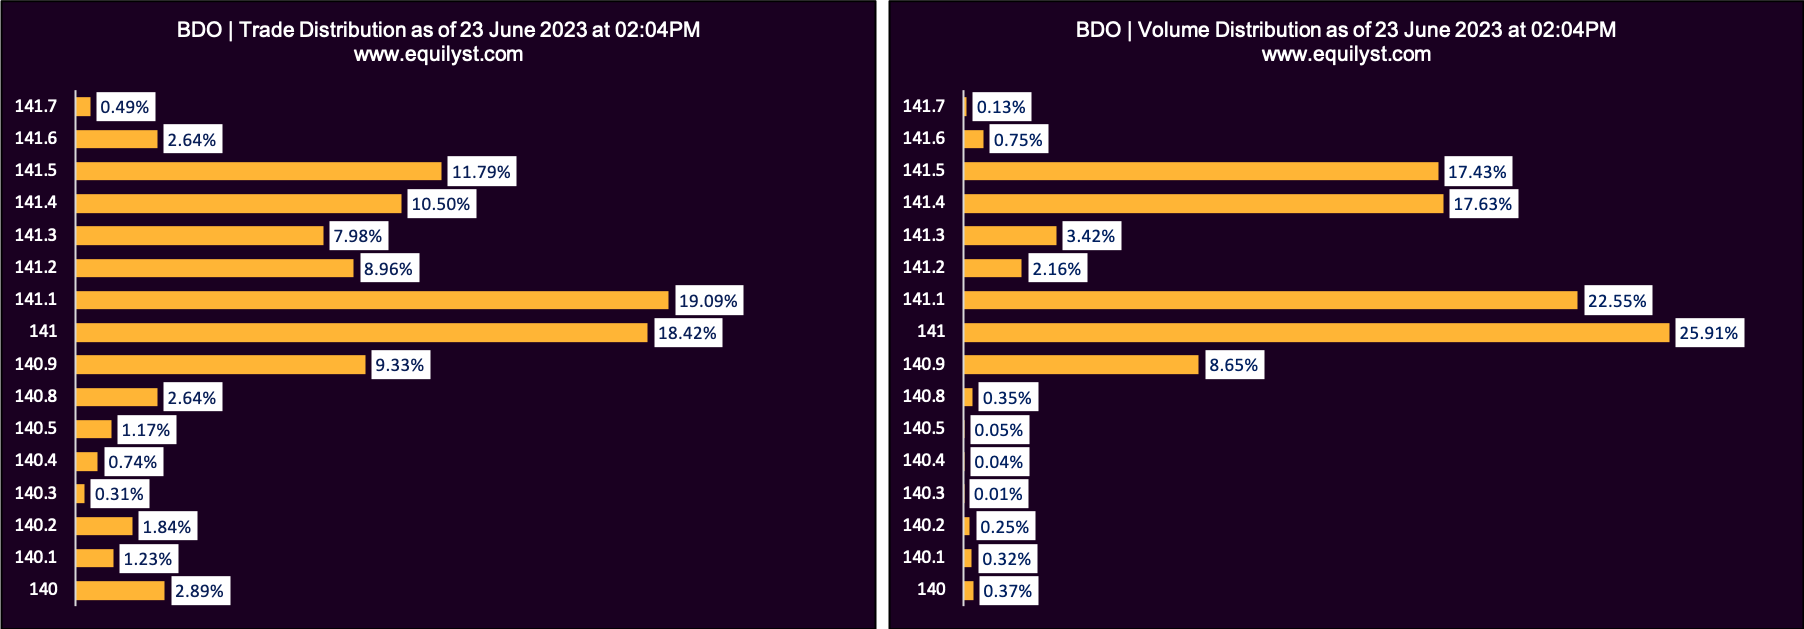
BDO Unibank (BDO)
Dominant Range Index: BULLISH
Last Price: 141.1
VWAP: 141.18
Dominant Range: 141 – 141.1
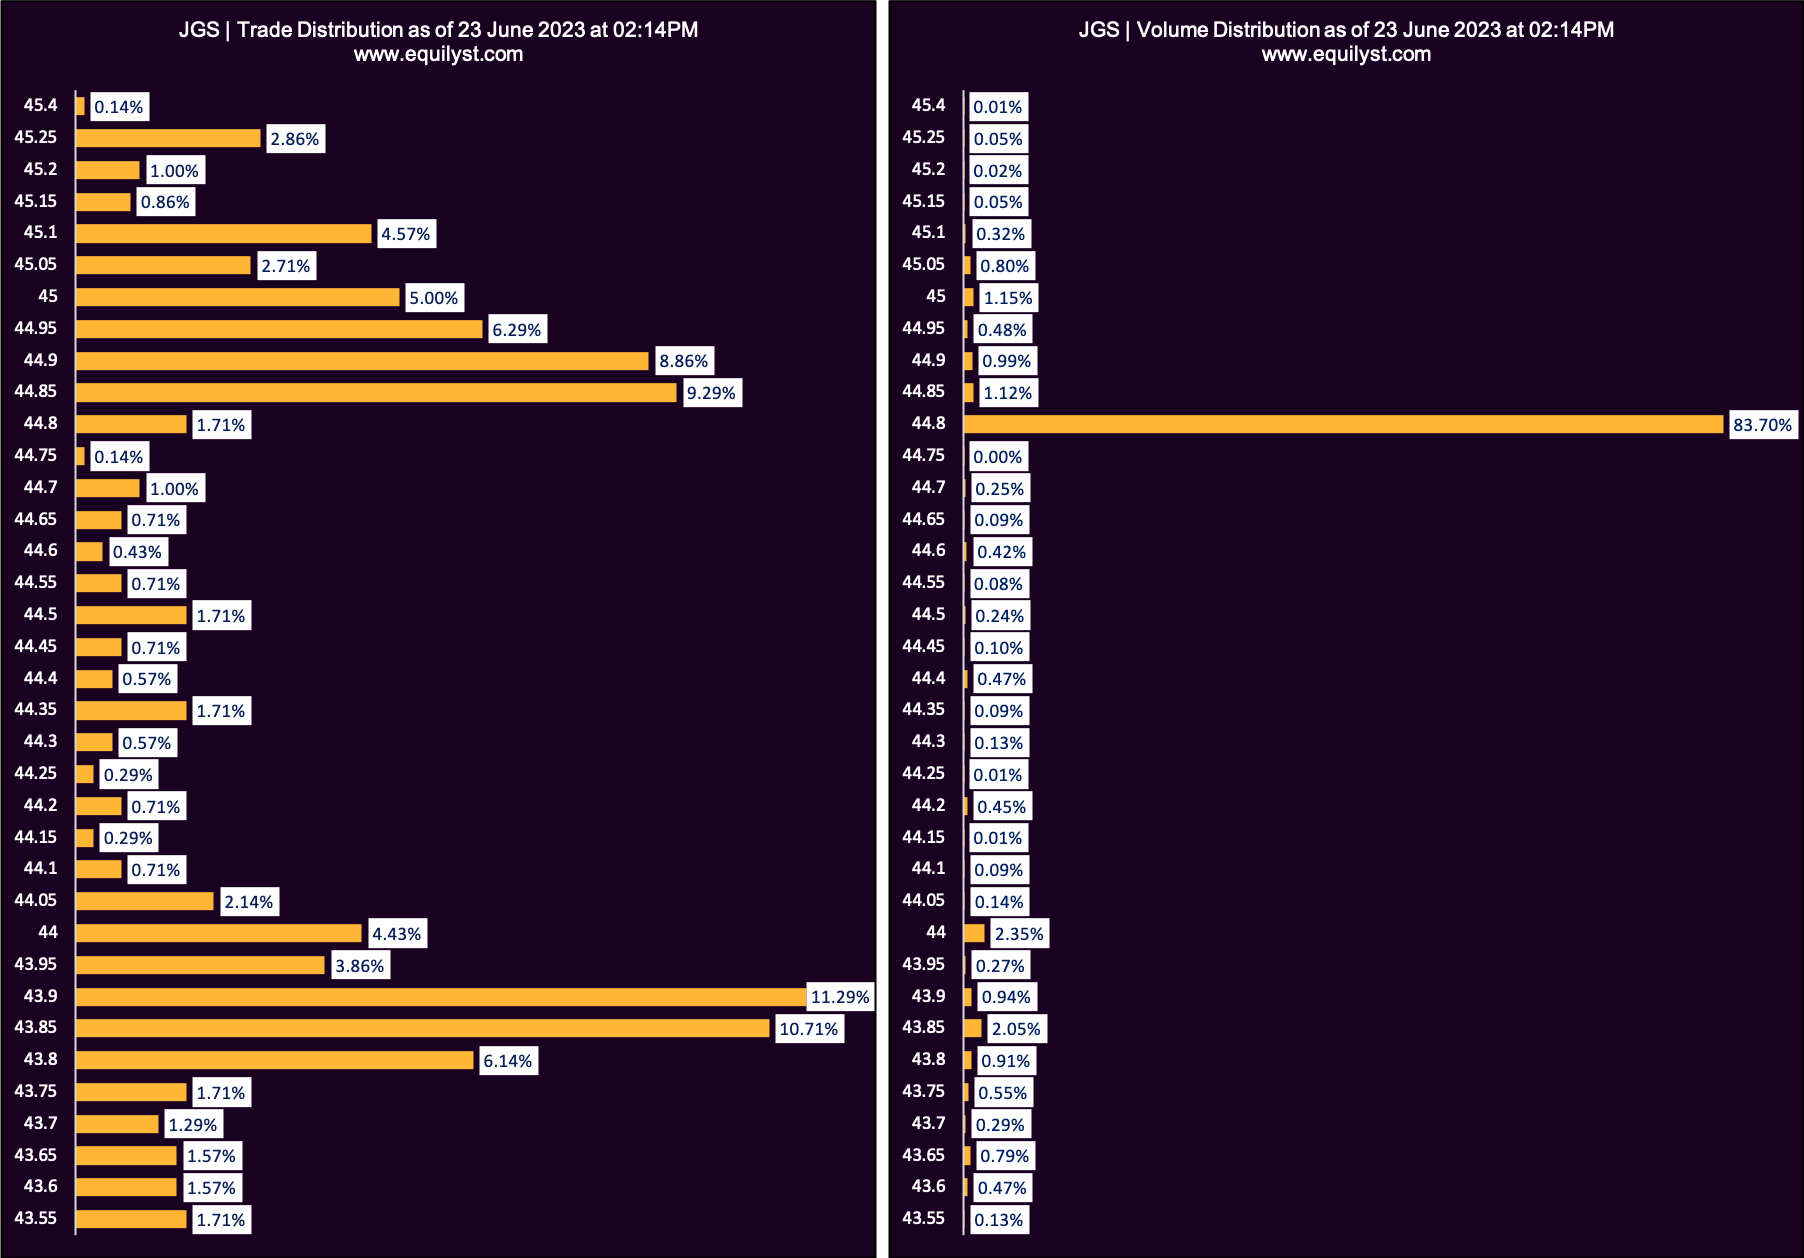
JG Summit Holdings (JGS)
Dominant Range Index: BEARISH
Last Price: 43.7
VWAP: 44.71
Dominant Range: 43.9 – 44.8
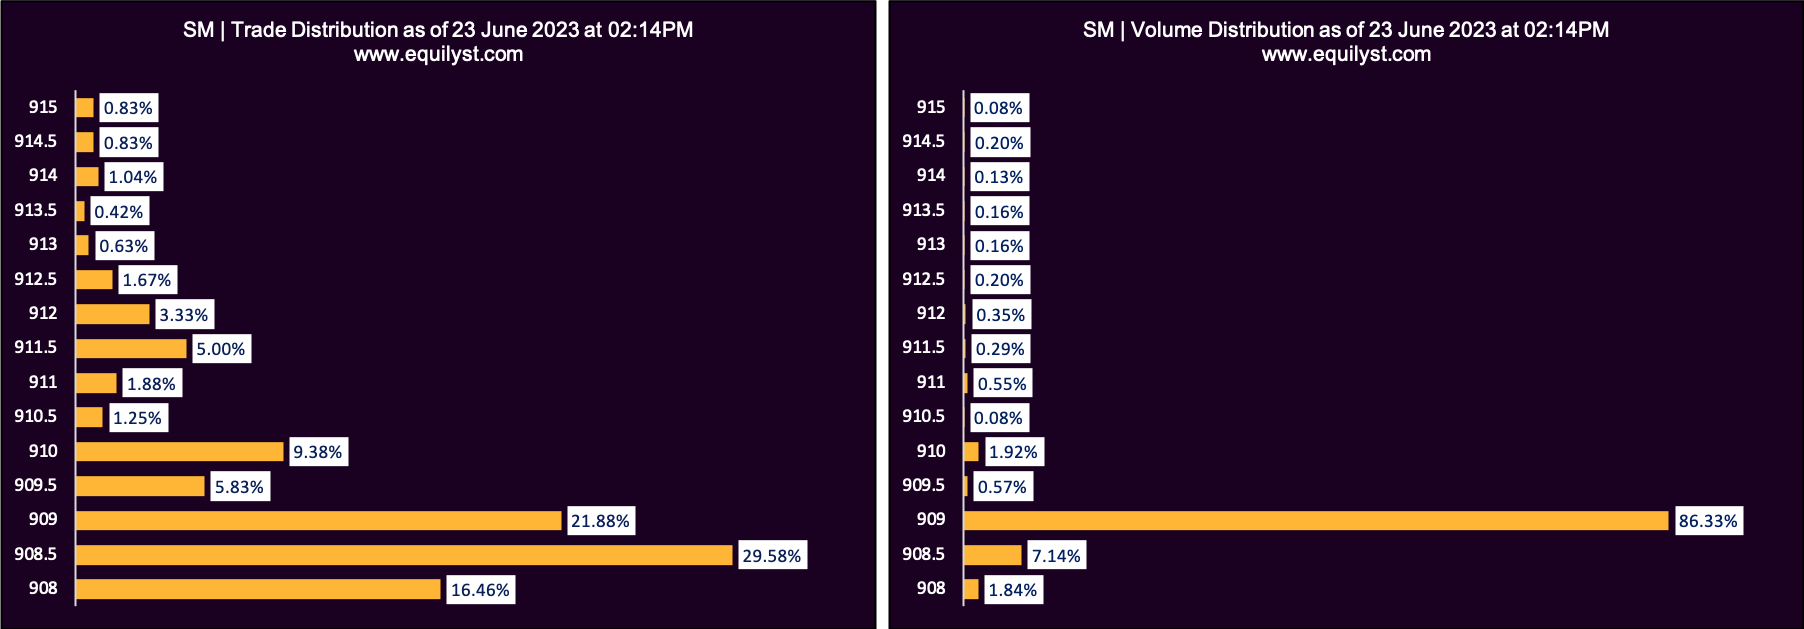
SM Investments Corporation (SM)
Dominant Range Index: BEARISH
Last Price: 911.5
VWAP: 909.04
Dominant Range: 908.5 – 909
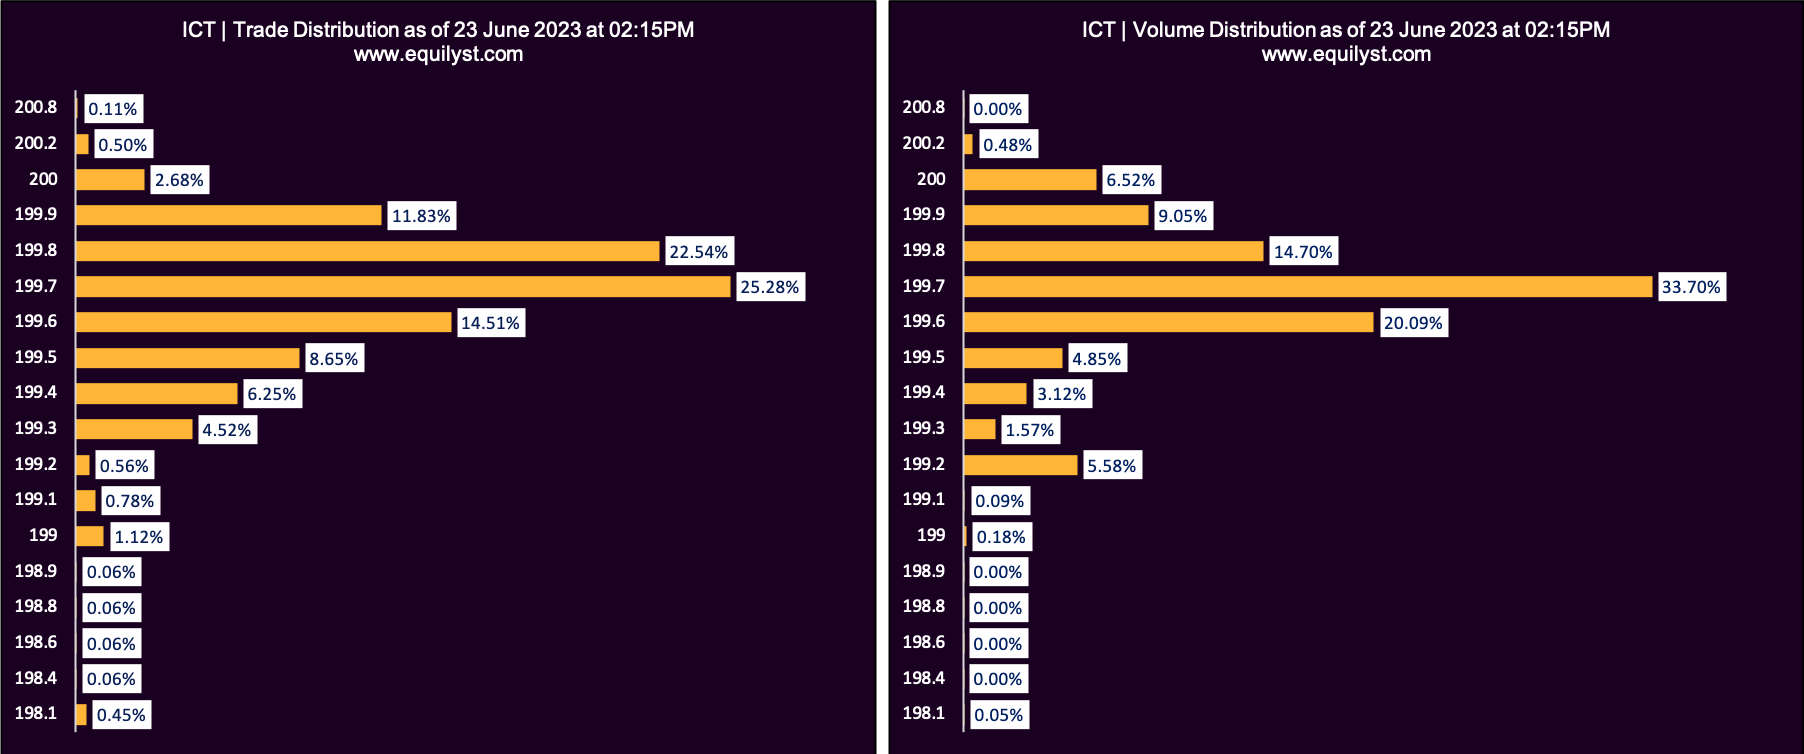
Int’l Container Terminal Services (ICT)
Dominant Range Index: BULLISH
Last Price: 199.9
VWAP: 199.68
Dominant Range: 199.7 – 199.7
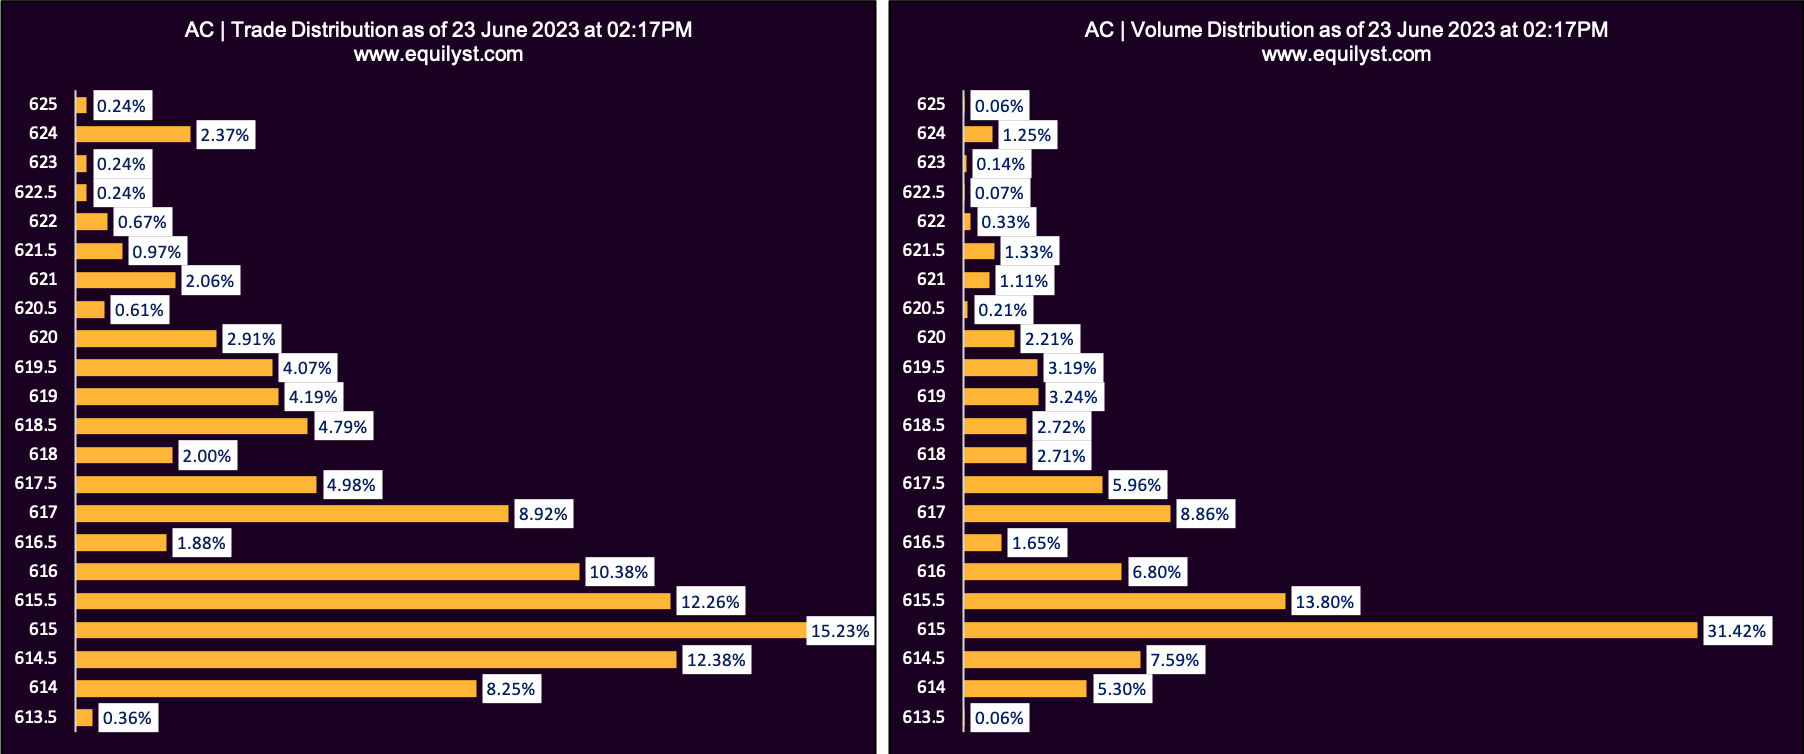
Ayala Corporation (AC)
Dominant Range Index: BEARISH
Last Price: 615
VWAP: 616.28
Dominant Range: 615 – 615
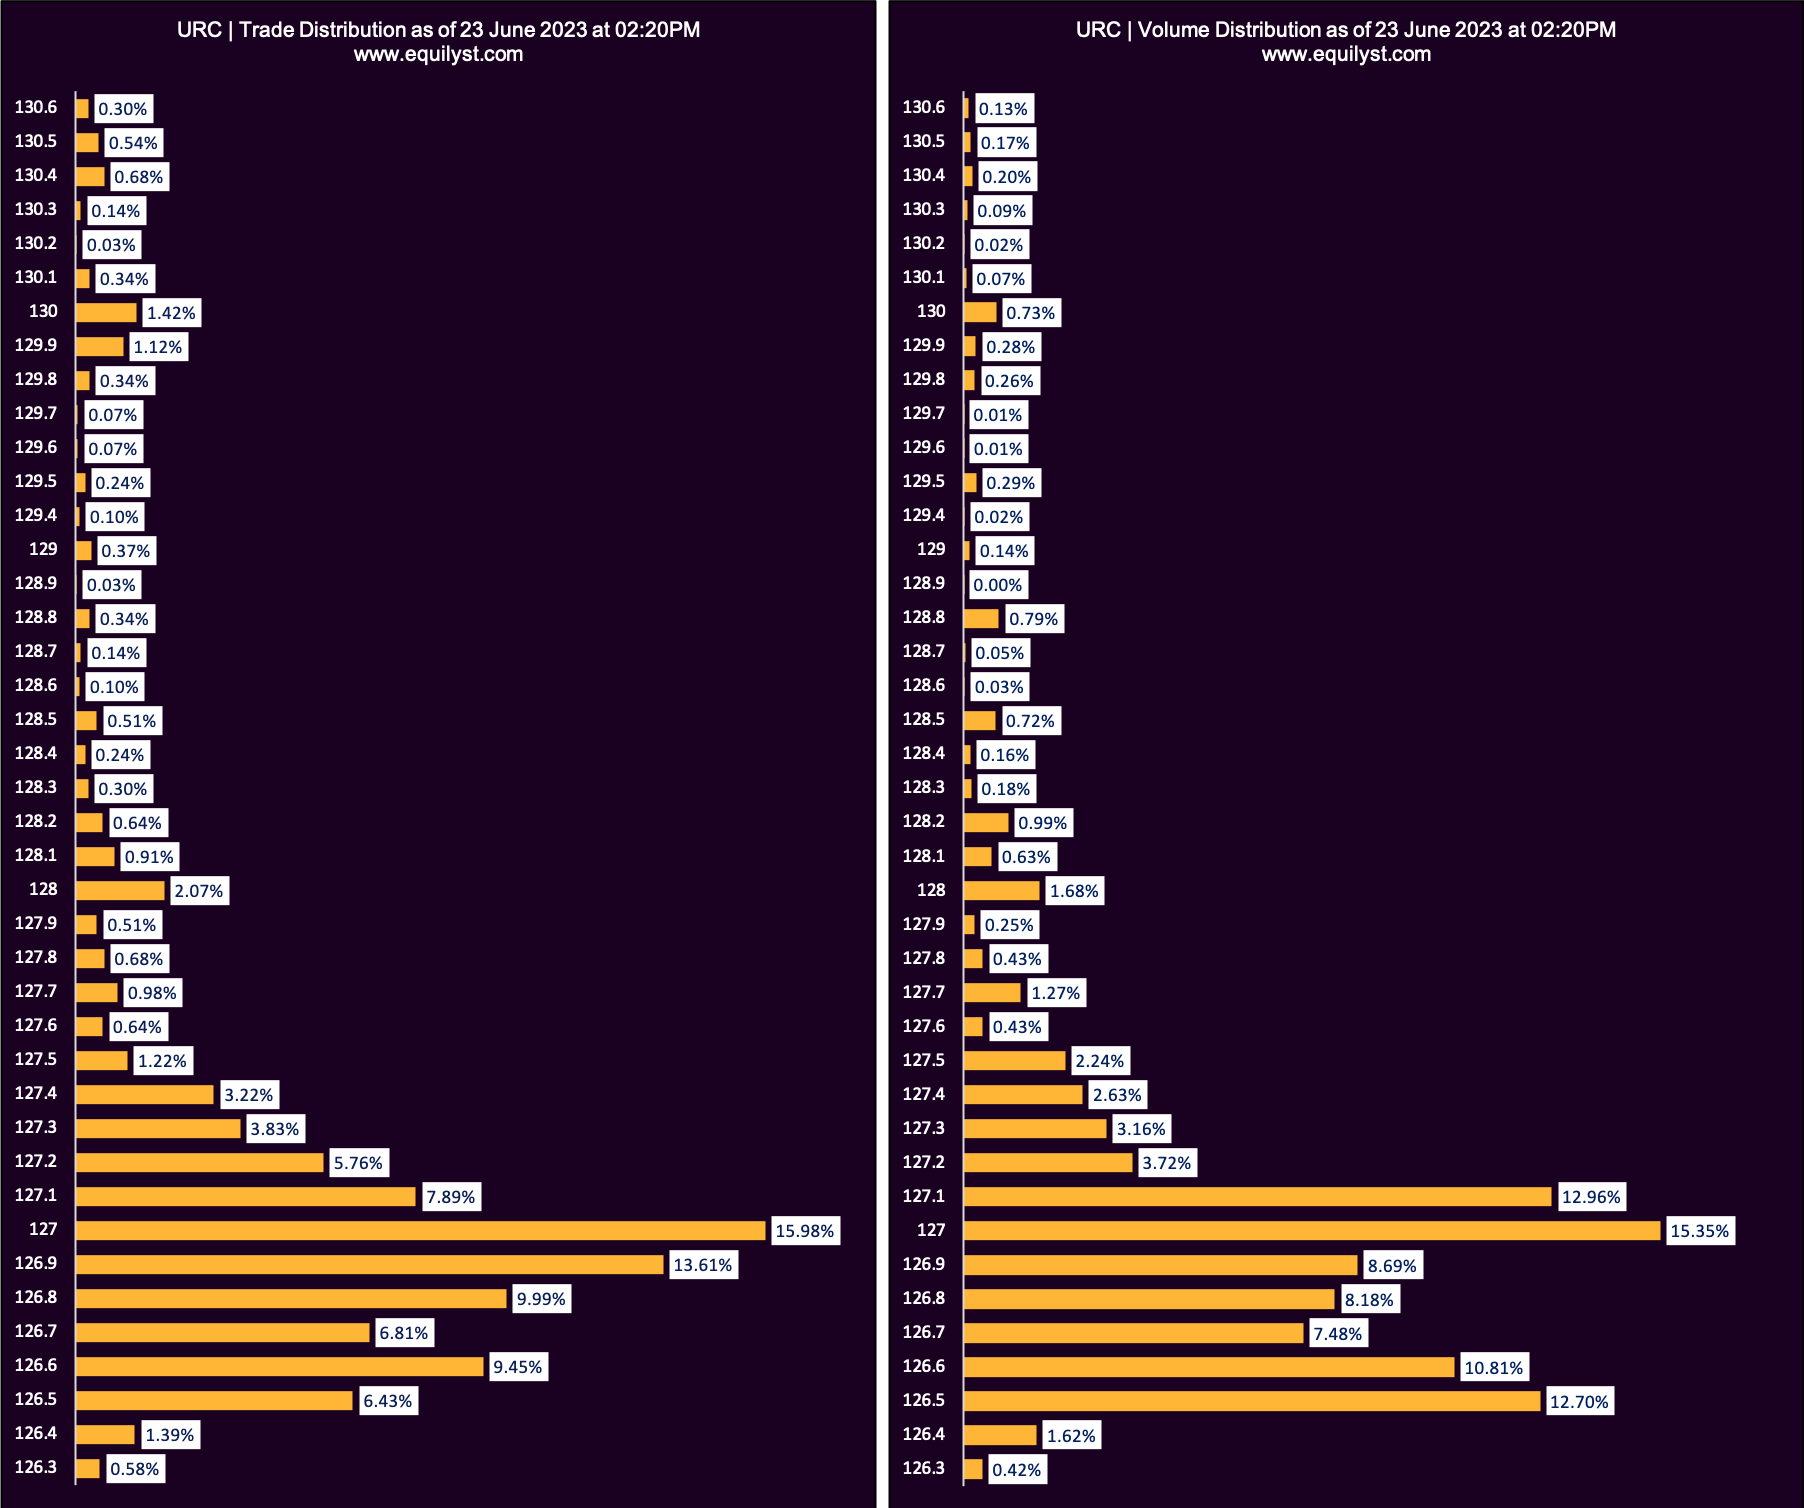
Universal Robina Corporation (URC)
Dominant Range Index: BEARISH
Last Price: 126.5
VWAP: 127.04
Dominant Range: 127 – 127
Ayala Land (ALI)
Dominant Range Index: BULLISH
Last Price: 24.25
VWAP: 24.21
Dominant Range: 24.2 – 24.2
Emperador (EMI)
Dominant Range Index: BULLISH
Last Price: 21.6
VWAP: 21.60
Dominant Range: 21.6 – 21.6
Greenergy Holdings (GREEN)
Dominant Range Index: BULLISH
Last Price: 1.44
VWAP: 1.42
Dominant Range: 1.44 – 1.44
Metro Pacific Investments Corporation (MPI)
Dominant Range Index: BULLISH
Last Price: 4.56
VWAP: 4.58
Dominant Range: 4.58 – 4.58
Assistance Required?
Should you require additional guidance and a deeper understanding of my Dominant Range Index, as well as the comprehensive principles encompassed within my Evergreen Strategy When Trading and Investing in the Philippine Stock Market, I invite you to take advantage of my stock market consultancy service. Through a personalized 1-on-1 online workshop, I will impart valuable insights on capital preservation, gain protection, and effective loss prevention techniques. There are three packages you can choose from. Please don’t hesitate to reach out to me for further details and to schedule a session. Click here to see the packages.
- MA, BDO, ALI, URC, PX: Is Their Dominant Range Pointing to a Breakout? - March 14, 2025
- Tracking Market Sentiment: MTD Ratings for 30 Bluechip Stocks (March 2025) - March 13, 2025
- PSEi Stalls Below 6,260 as Market Awaits Political Shift - March 12, 2025


