If you have APL, GEO, and CNVRG in your portfolio, or if you’re planning to take a new position in any of these three stocks, I hope that my analysis will help you make a data-driven and logical investment decision.
What criteria did I use in choosing APL, GEO, and CNVRG?
I went to the Top Gainers’ list and sorted the list according to the highest total turnover value. So, you cannot say I’m selectively featuring stocks I already have because my selection criteria don’t allow me to cherry-pick which stocks to feature.
I have four criteria when analyzing if the stock has a confirmed buy signal.
Firstly, the last price must be higher than its 10-day simple moving average. Not less. Not equal. Higher.
Secondly, the prevailing volume must be higher than at least 50% of the stock’s 10-day volume average.
The first and second criteria are indicators available on your broker’s platform. The last two criteria can only be produced by me.
Thirdly, the prevailing Dominant Range Index of the stock must be bullish. I can’t tell how this proprietary indicator churns out a bearish or bullish signal because it’s proprietary/
Fourthly, either the prevailing (or EOD) or month-to-date (MTD) Market Sentiment Index should be bullish. This is also my proprietary indicator.
So, a stock must get four bullish signals for it to have a confirmed buy signal for me. Once there’s a confirmed buy signal, I can either take a new position or top up my existing one.
Now that you know how I analyze, let’s go to my analysis.
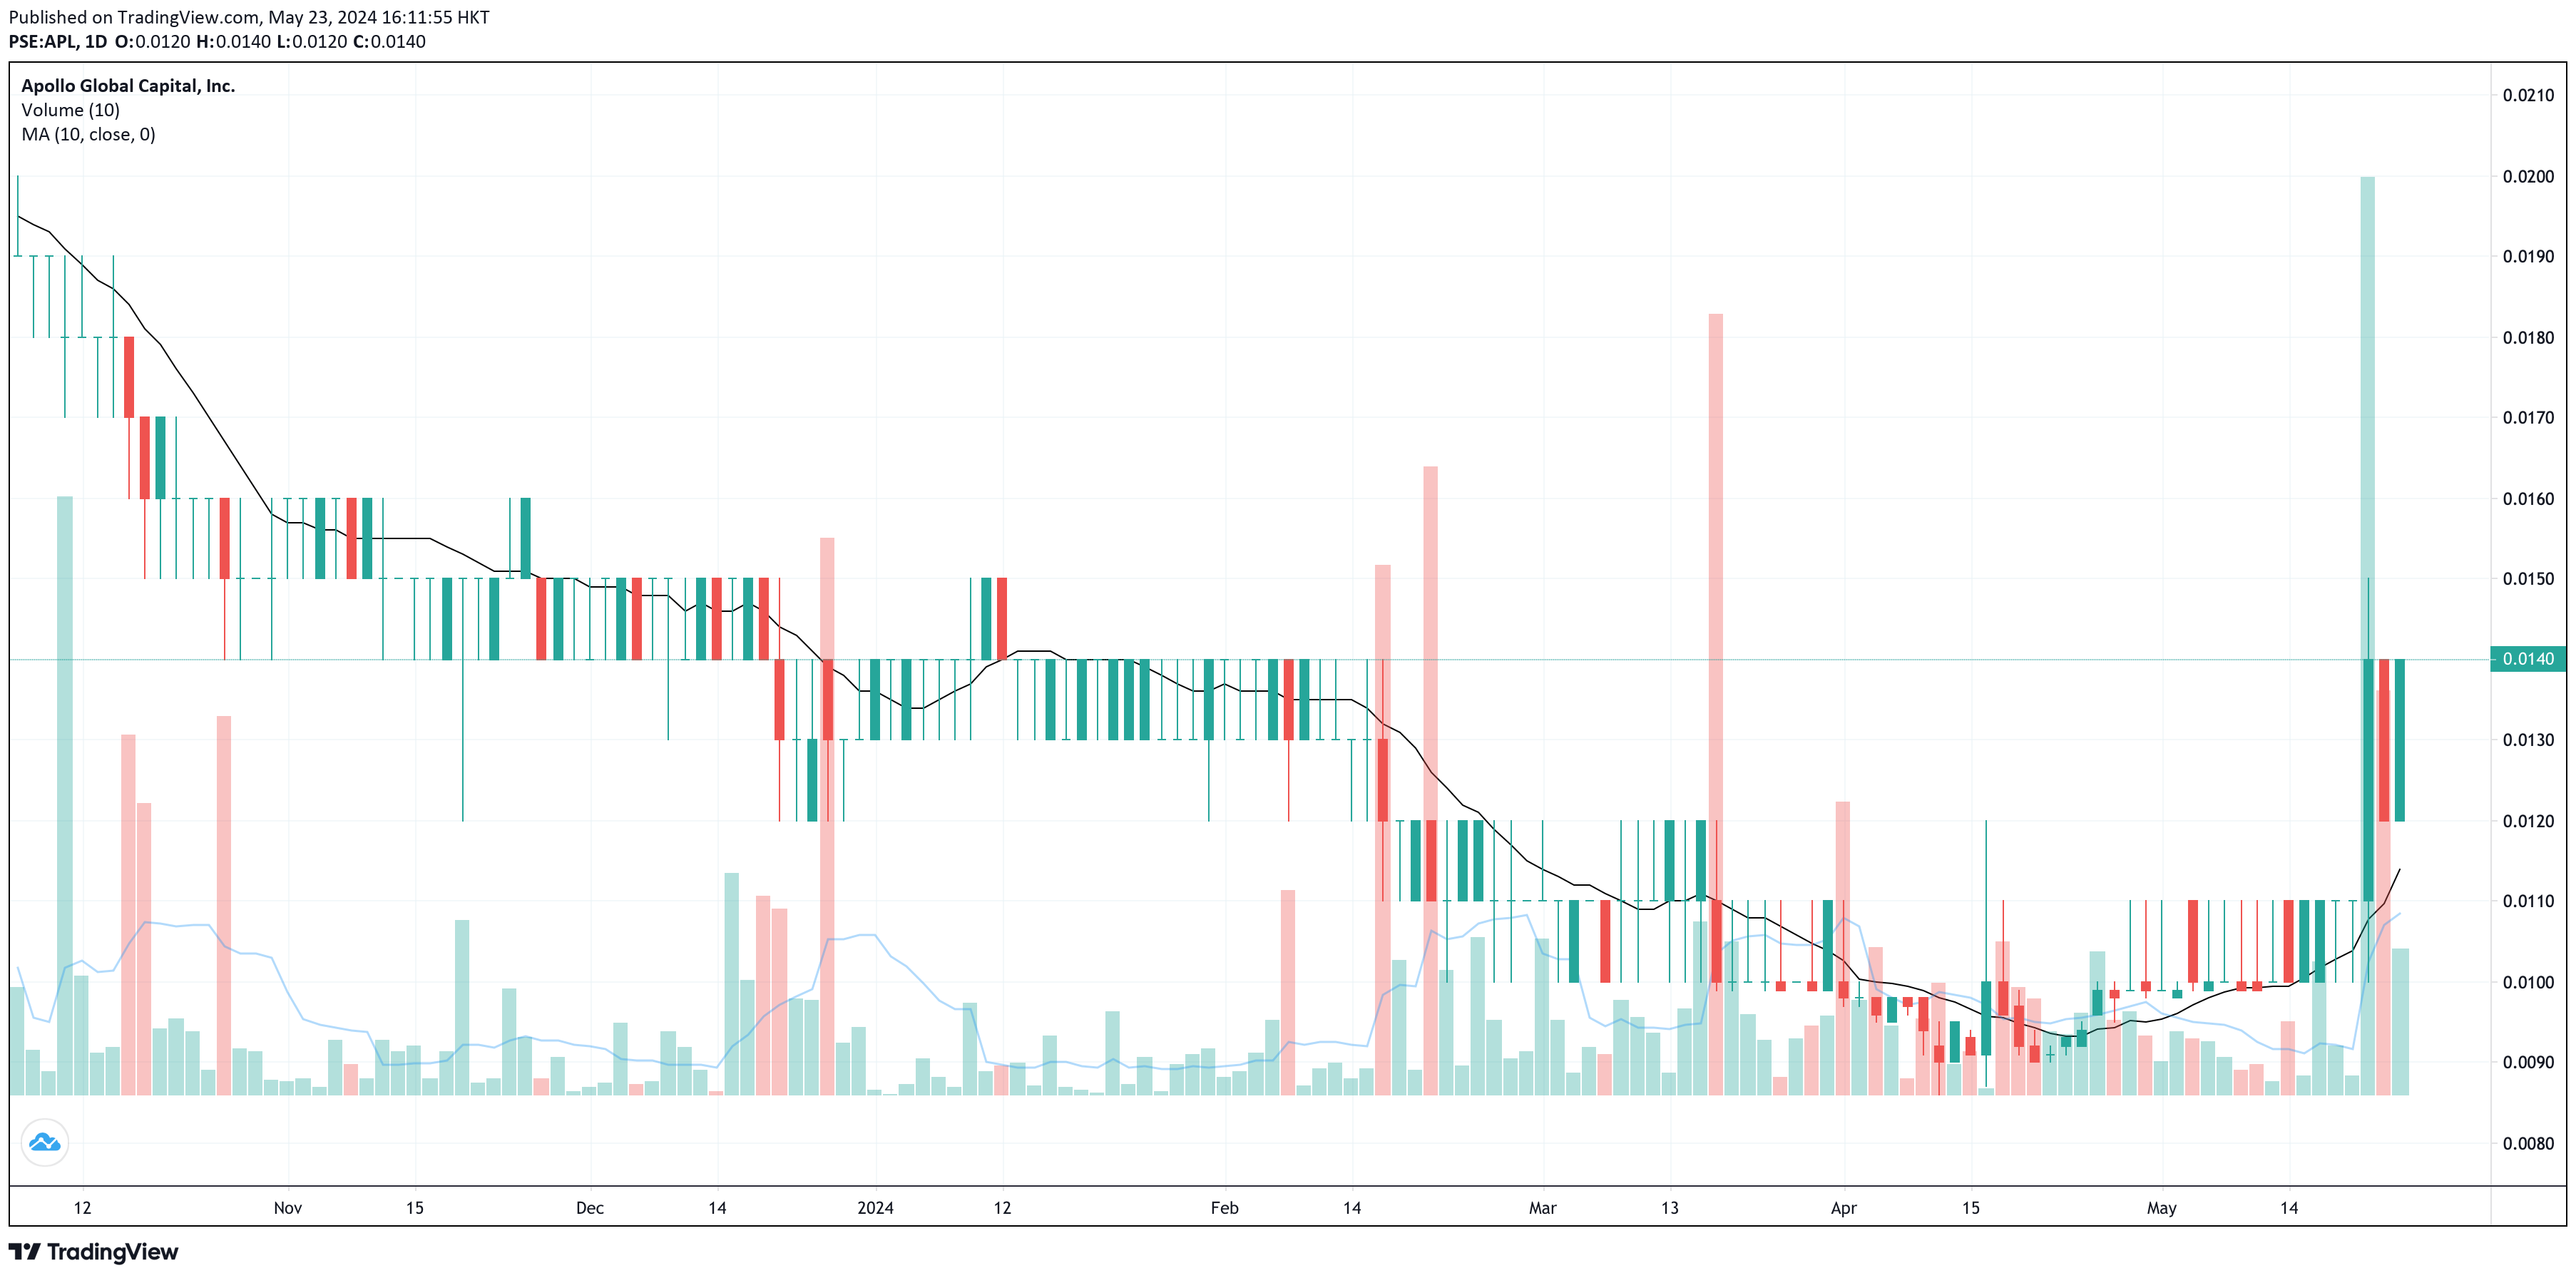
Does Apollo Global Capital (APL) have a buy signal?
No, there’s no buy signal for APL as of the end of trading on May 23, 2024. It almost secured a buy signal if not for the bearish EOD and MTD Market Sentiment Index.
First Criterion: BULLISH
Second Criterion: BULLISH
Dominant Range Index: BULLISH
Last Price: 0.014
Dominant Range: 0.013 – 0.014
VWAP: 0.010
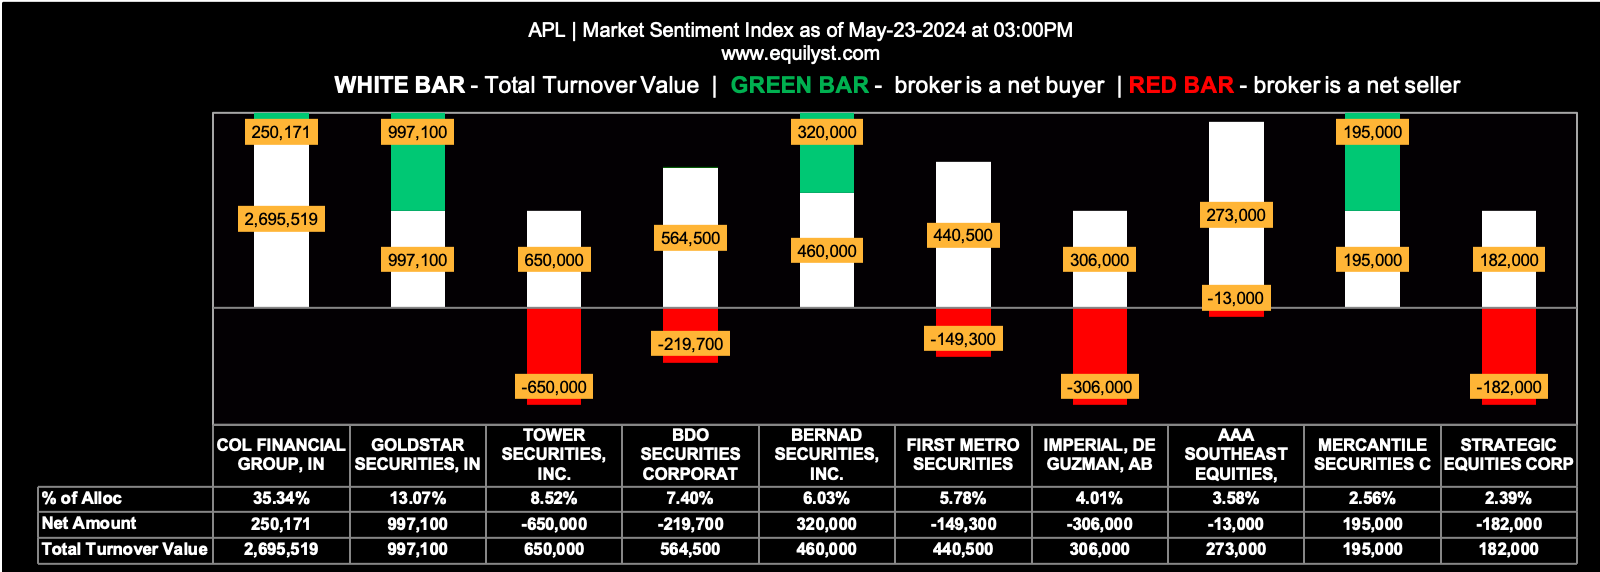
Market Sentiment Index (May 23, 2024): BEARISH
9 of the 24 participating brokers, or 37.50% of all participants, registered a positive Net Amount
9 of the 24 participating brokers, or 37.50% of all participants, registered a higher Buying Average than Selling Average
24 Participating Brokers’ Buying Average: ₱0.01328
24 Participating Brokers’ Selling Average: ₱0.01326
5 out of 24 participants, or 20.83% of all participants, registered a 100% BUYING activity
9 out of 24 participants, or 37.50% of all participants, registered a 100% SELLING activity
Market Sentiment Index (May 2, 2024 – May 23, 2024): BEARISH
24 of the 53 participating brokers, or 45.28% of all participants, registered a positive Net Amount
22 of the 53 participating brokers, or 41.51% of all participants, registered a higher Buying Average than Selling Average
53 Participating Brokers’ Buying Average: ₱0.01240
53 Participating Brokers’ Selling Average: ₱0.01242
7 out of 53 participants, or 13.21% of all participants, registered a 100% BUYING activity
11 out of 53 participants, or 20.75% of all participants, registered a 100% SELLING activity
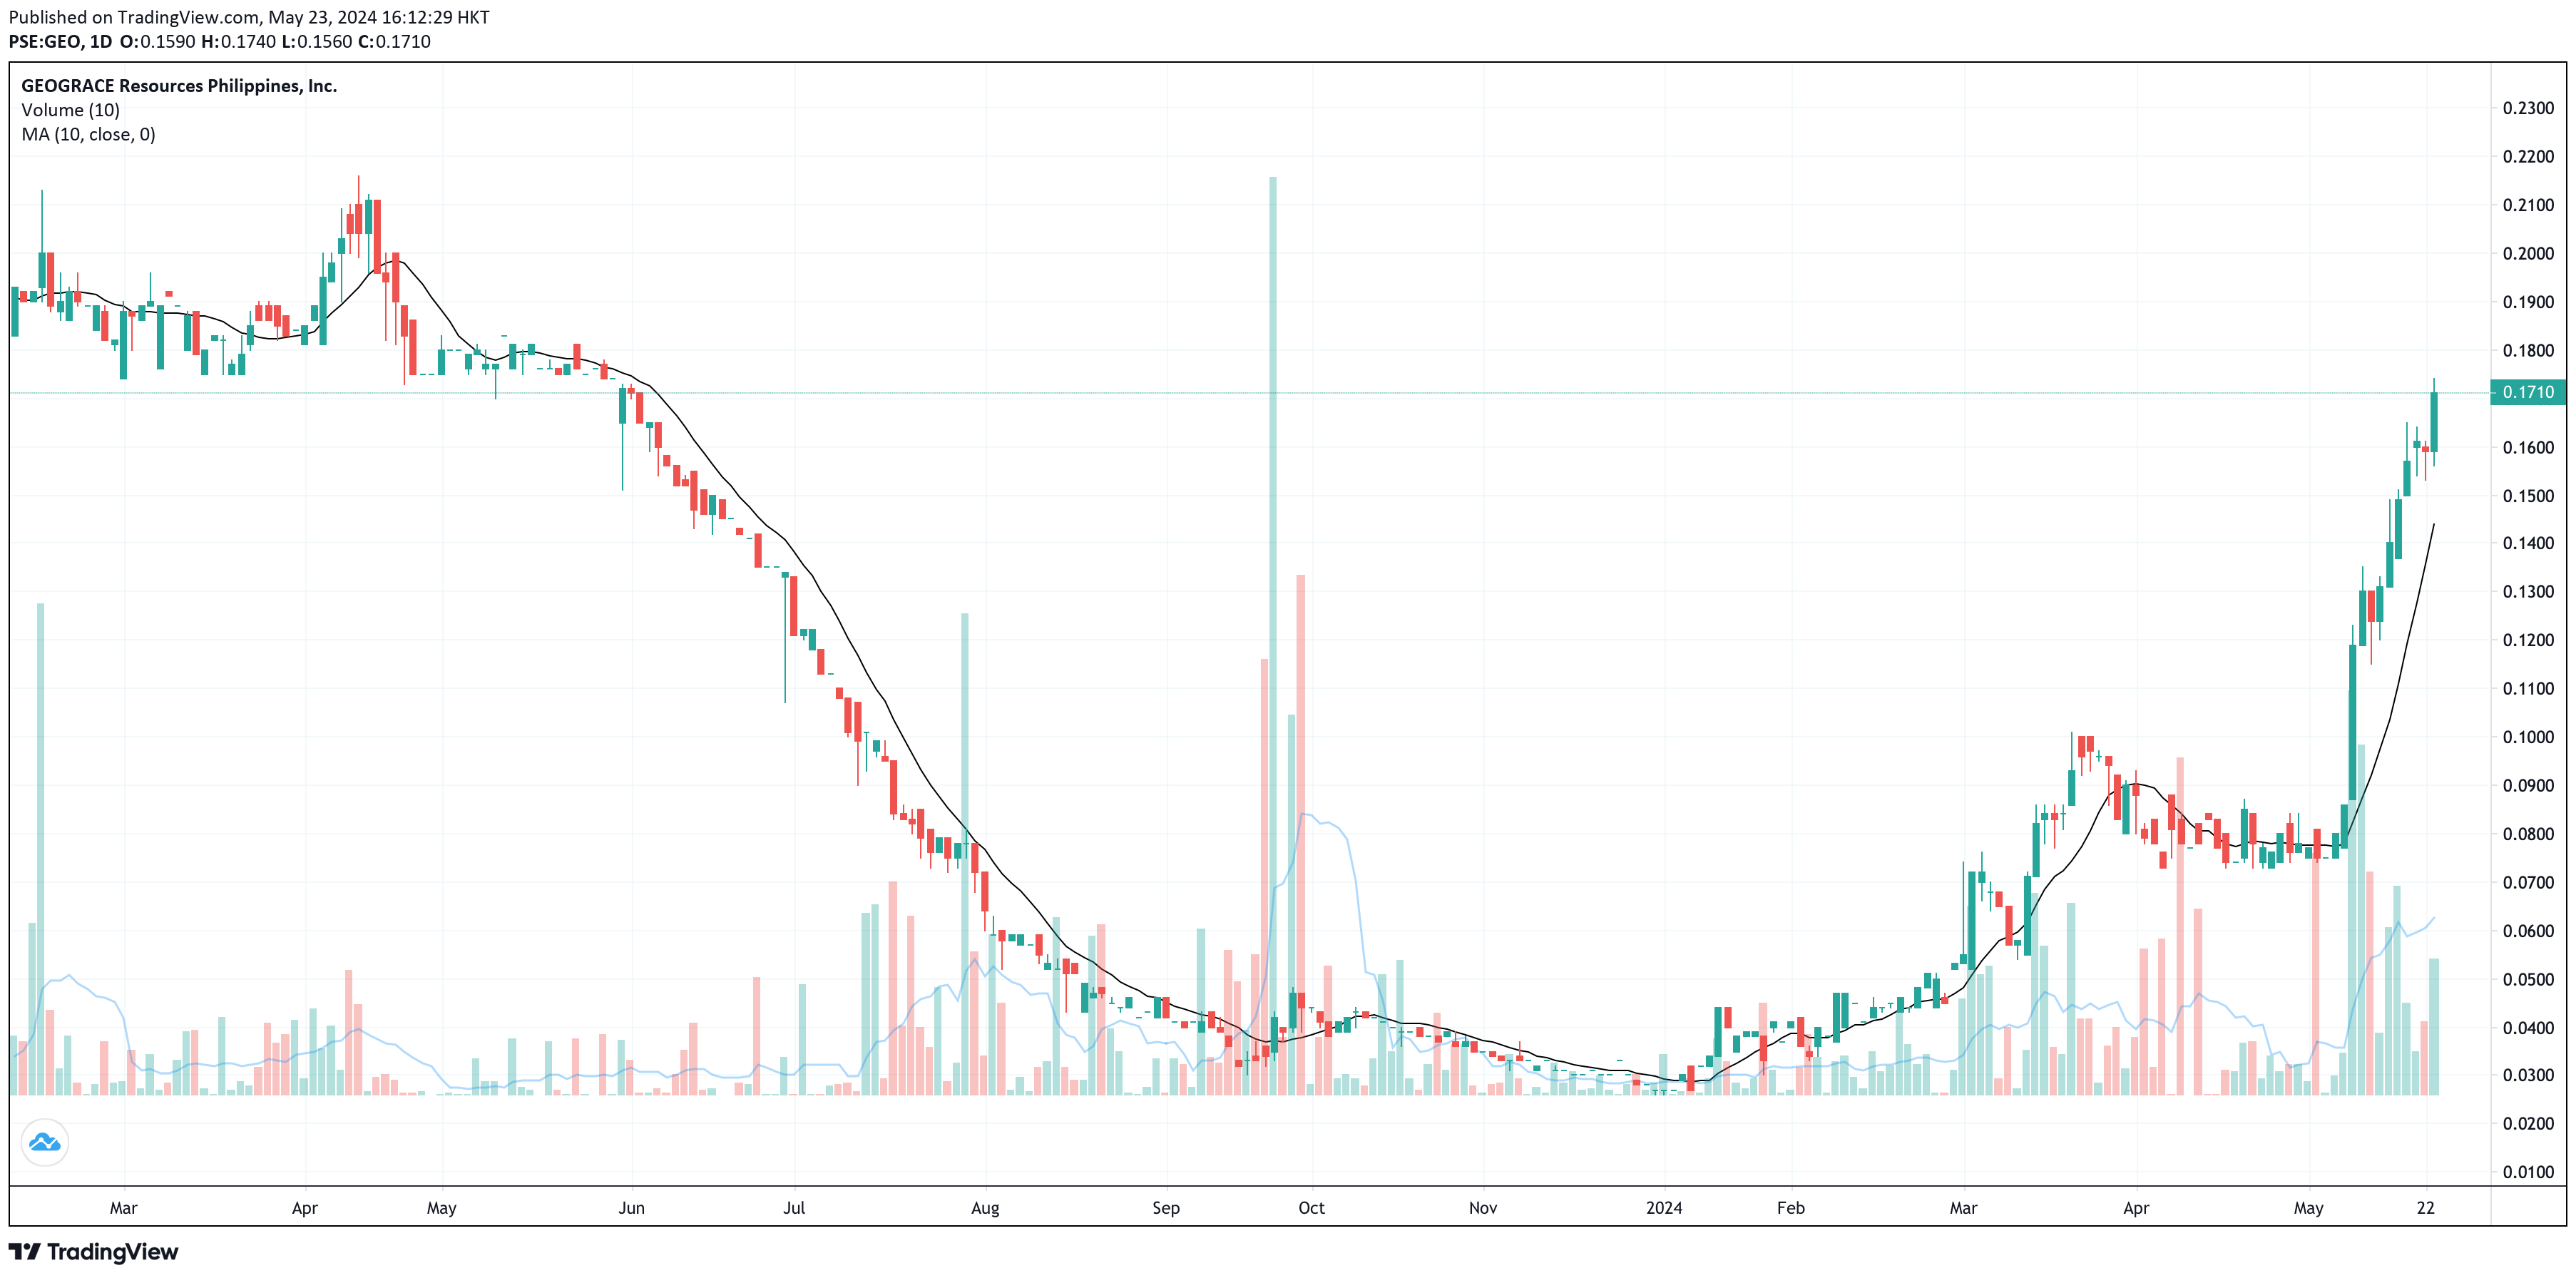
Does GEOGRACE Resources Philippines (GEO) have a buy signal?
No, there’s no buy signal for GEO as of the end of trading on May 23, 2024. The reason is the same as for APL.
First Criterion: BULLISH
Second Criterion: BULLISH
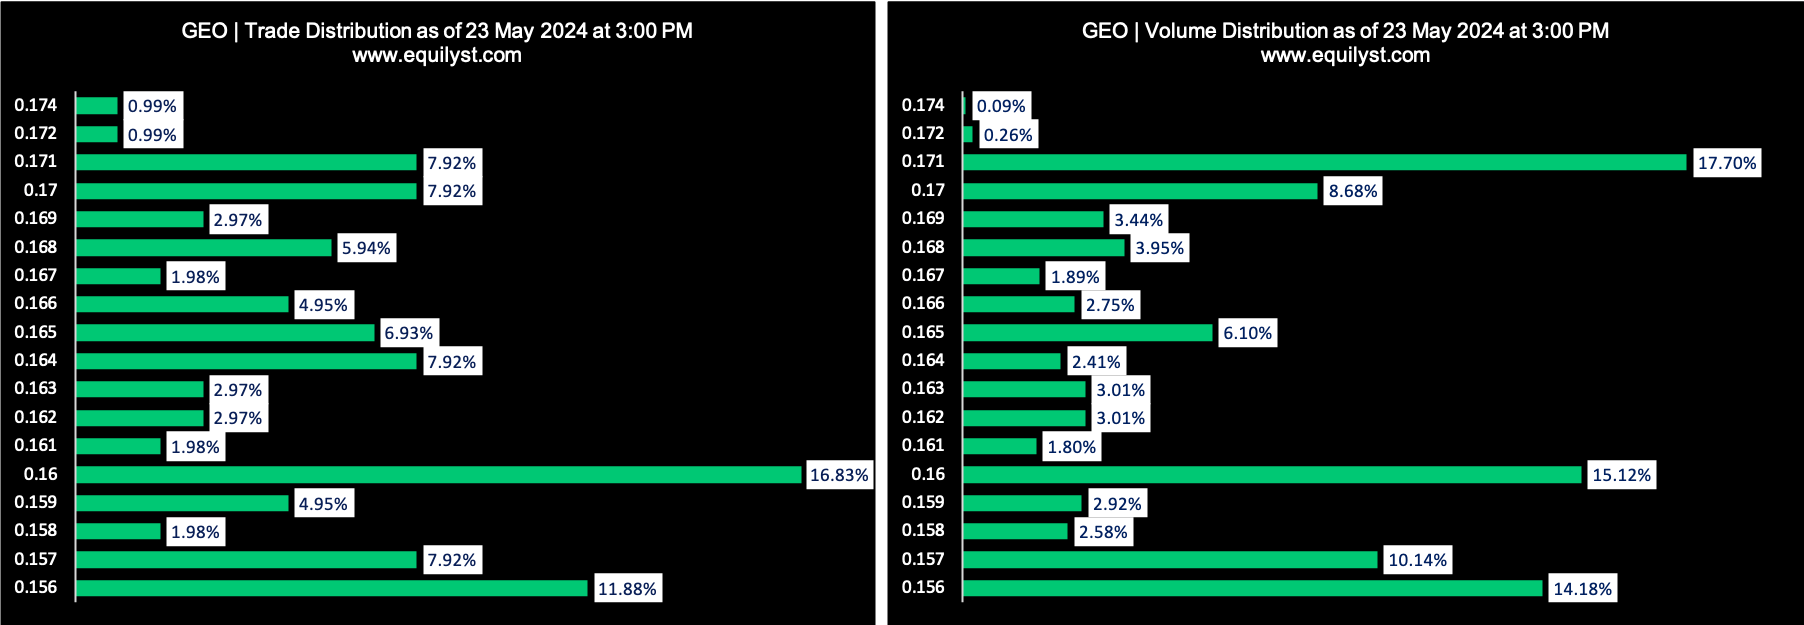
Dominant Range Index: BULLISH
Last Price: 0.171
Dominant Range: 0.170 – 0.171
VWAP: 0.160
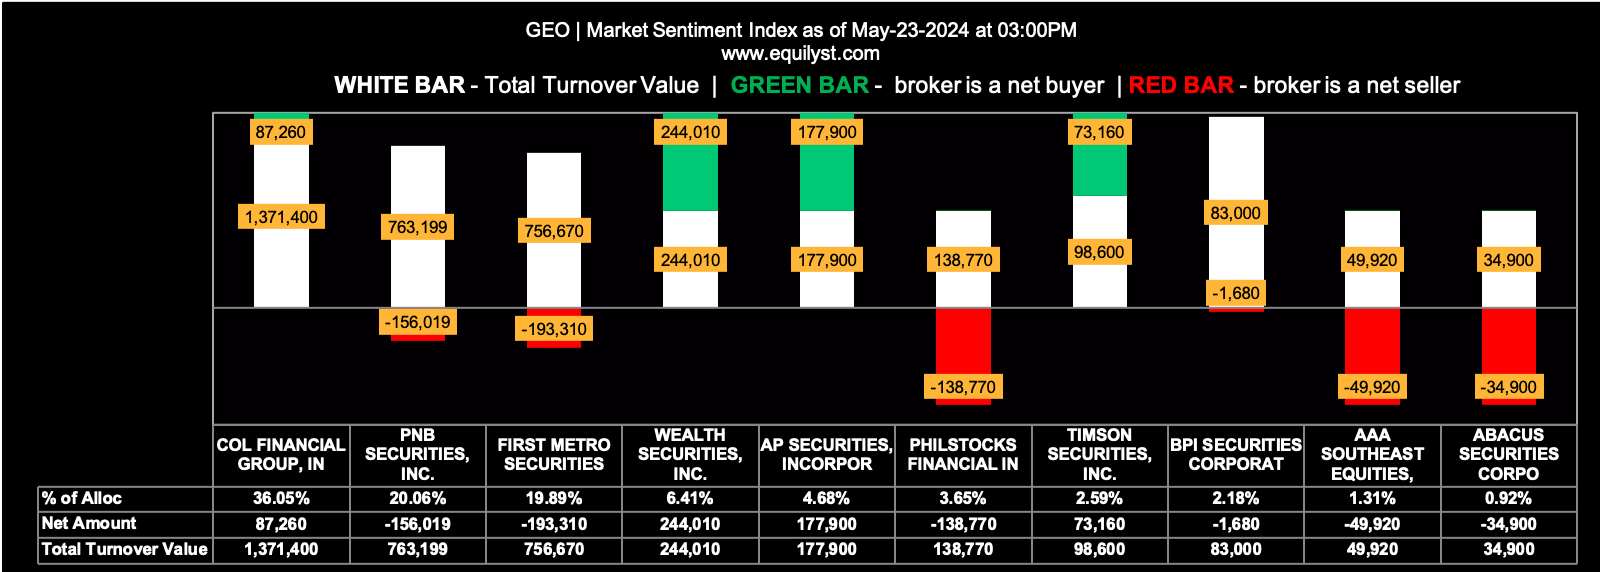
Market Sentiment Index (May 23, 2024): BEARISH
7 of the 15 participating brokers, or 46.67% of all participants, registered a positive Net Amount
8 of the 15 participating brokers, or 53.33% of all participants, registered a higher Buying Average than Selling Average
15 Participating Brokers’ Buying Average: ₱0.16382
15 Participating Brokers’ Selling Average: ₱0.16421
5 out of 15 participants, or 33.33% of all participants, registered a 100% BUYING activity
5 out of 15 participants, or 33.33% of all participants, registered a 100% SELLING activity
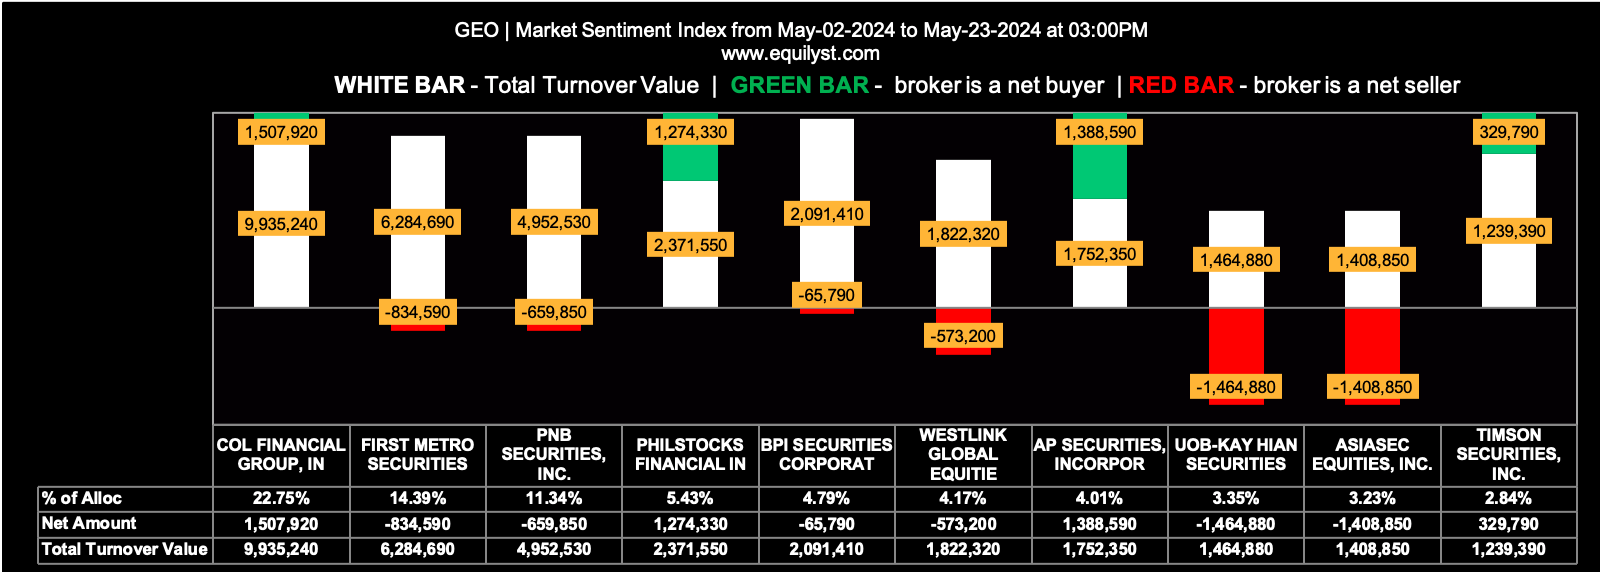
Market Sentiment Index (May 2, 2024 – May 23, 2024): BEARISH
15 of the 46 participating brokers, or 32.61% of all participants, registered a positive Net Amount
15 of the 46 participating brokers, or 32.61% of all participants, registered a higher Buying Average than Selling Average
46 Participating Brokers’ Buying Average: ₱0.12634
46 Participating Brokers’ Selling Average: ₱0.12238
6 out of 46 participants, or 13.04% of all participants, registered a 100% BUYING activity
14 out of 46 participants, or 30.43% of all participants, registered a 100% SELLING activity
Does Converge Information and Communications Technology Solutions (CNVRG) have a buy signal?
No, there’s no buy signal for GEO as of the end of trading on May 23, 2024. The reason is the same as for APL and CNVRG.
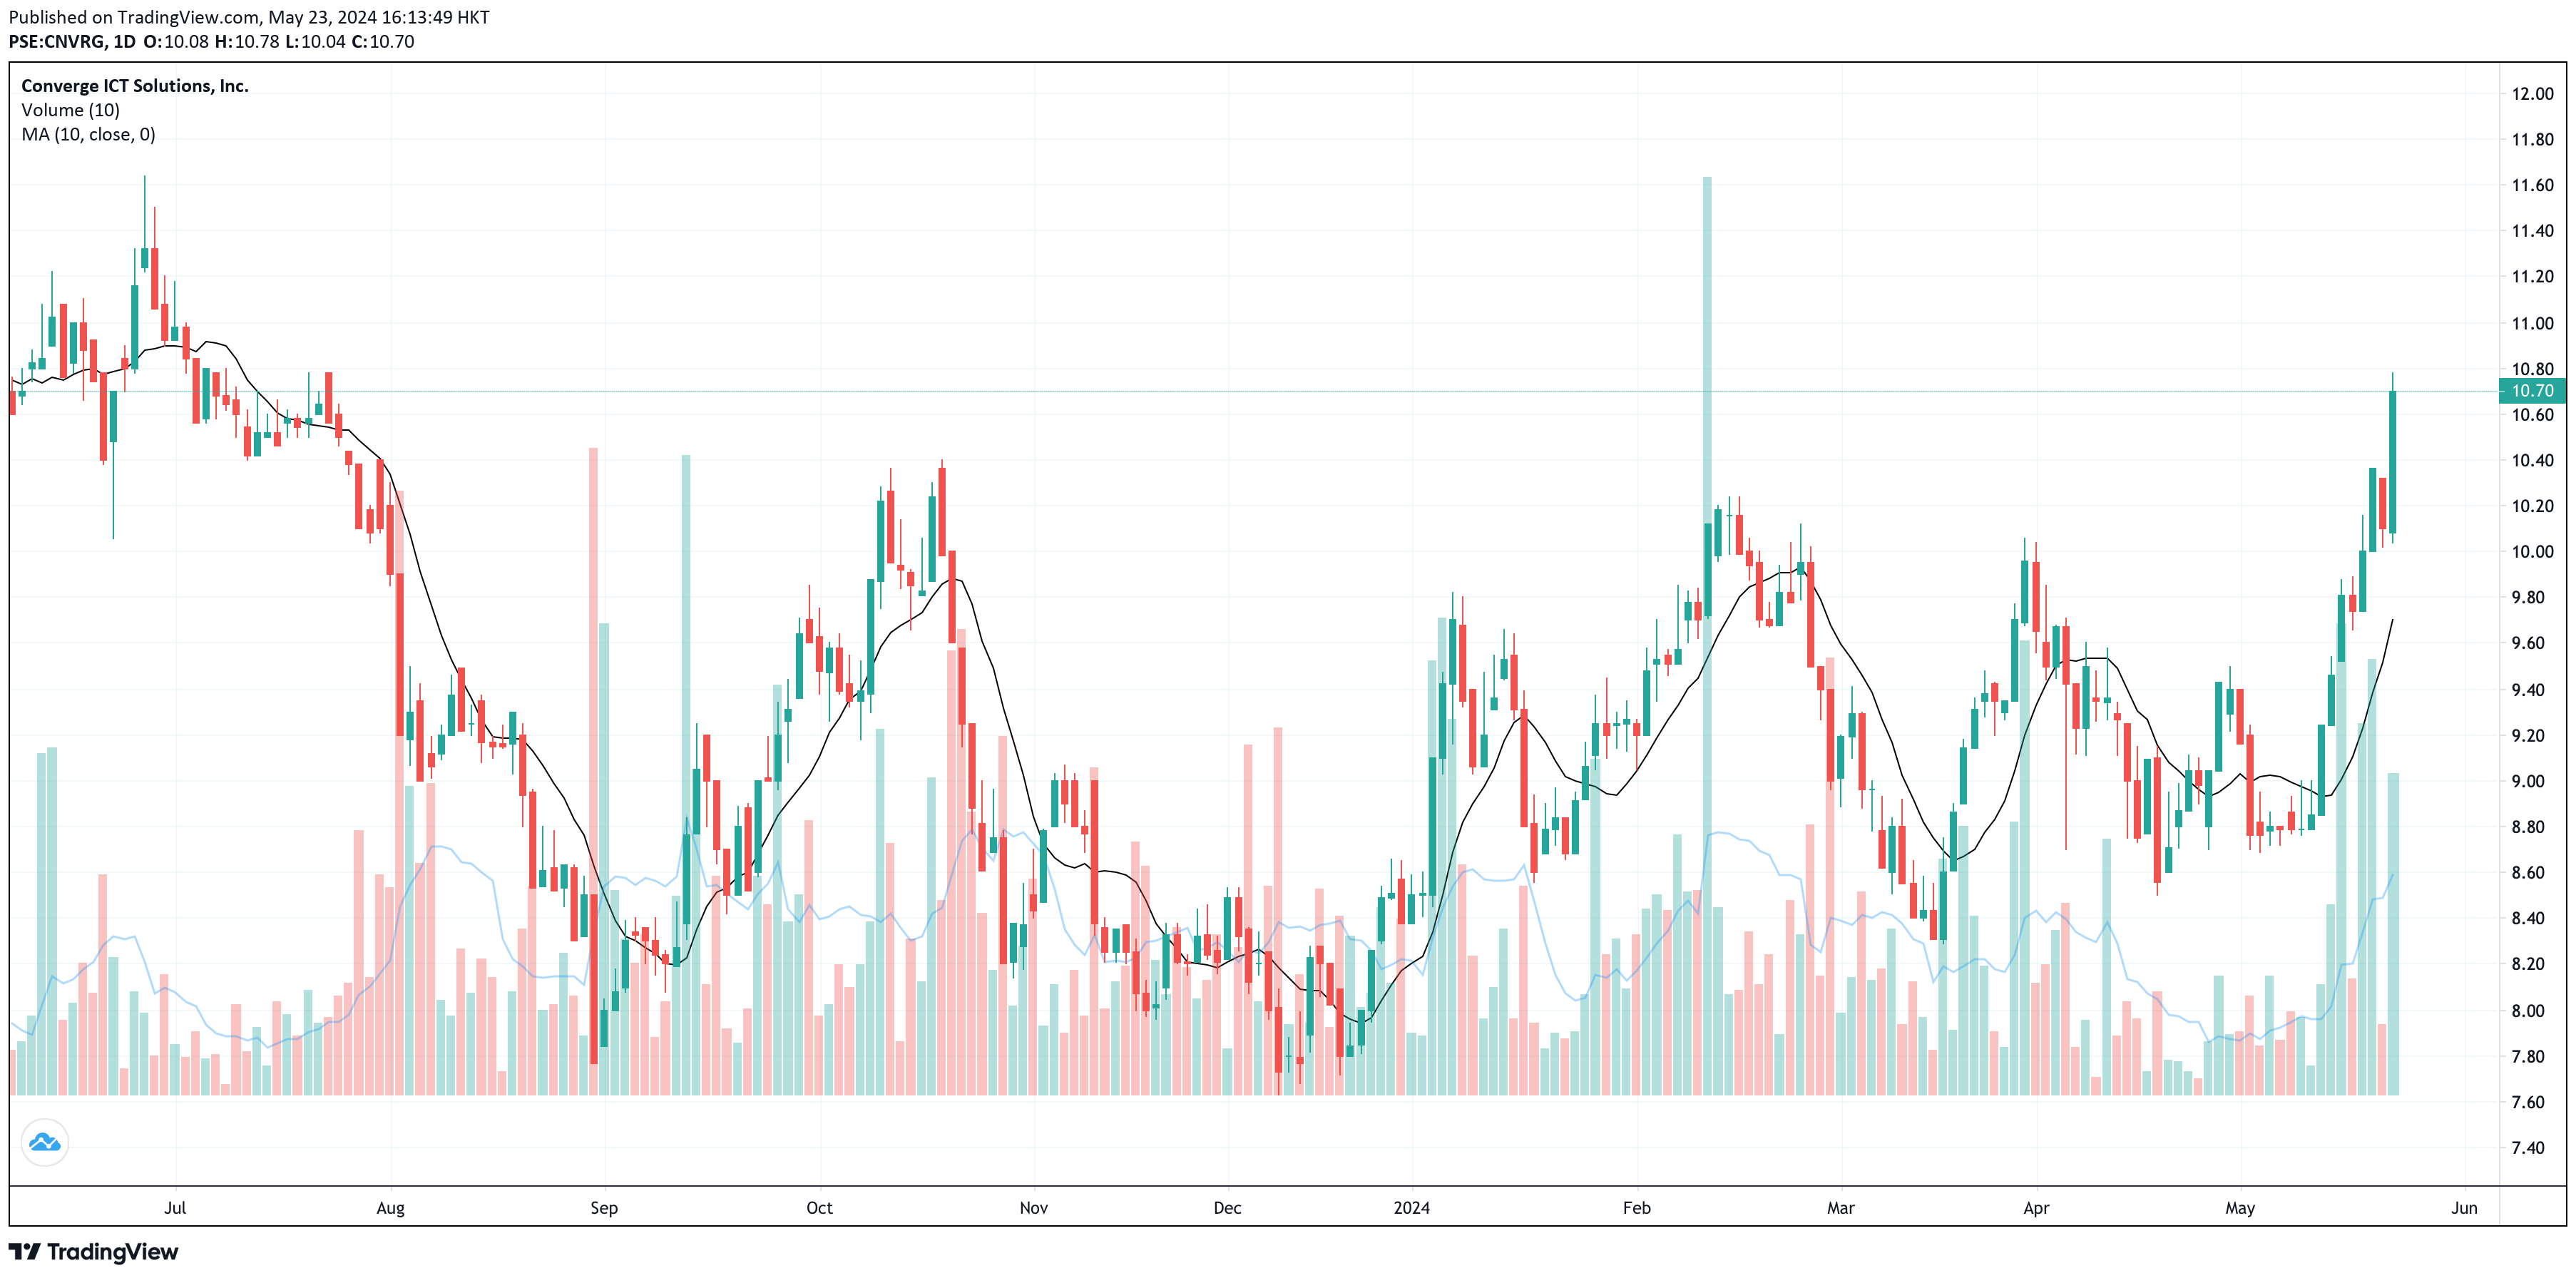
First Criterion: BULLISH
Second Criterion: BULLISH
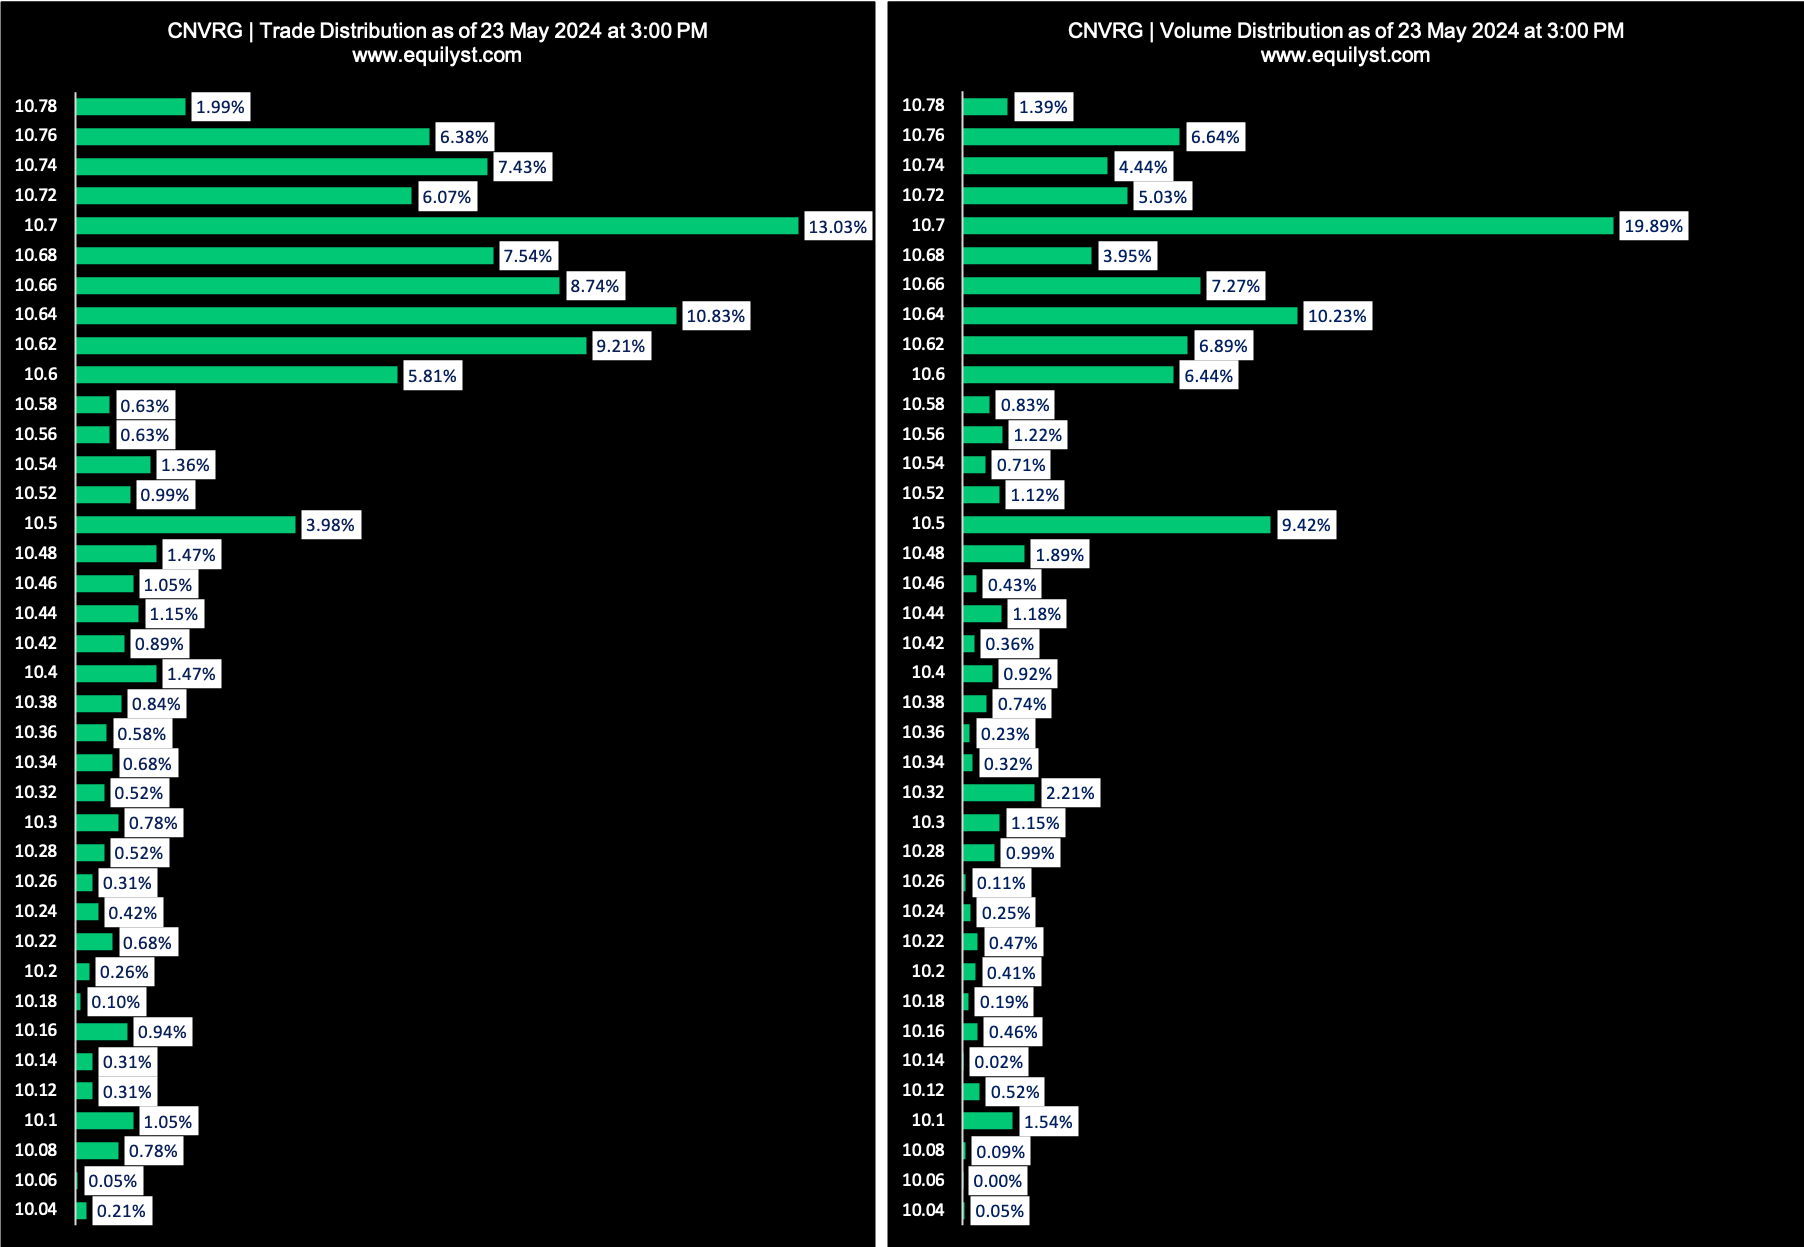
Dominant Range Index: BULLISH
Last Price: 10.7
Dominant Range: 10.7 – 10.7
VWAP: 10.610
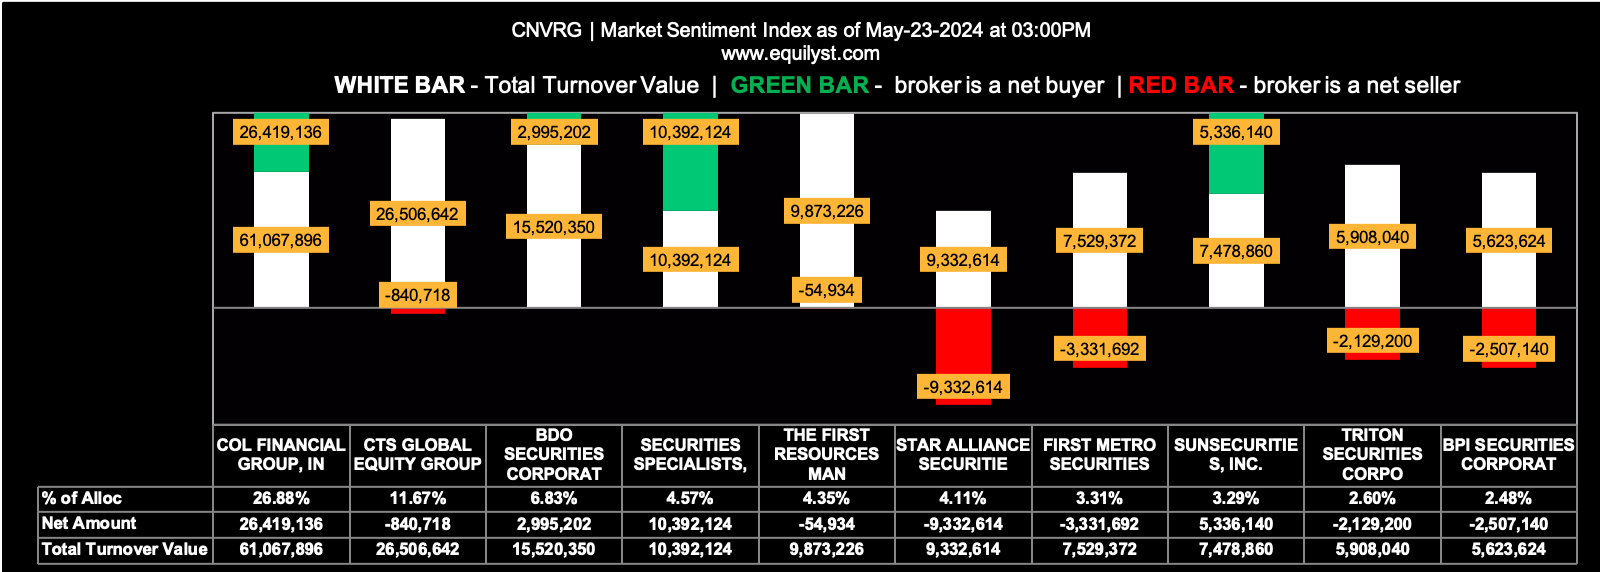
Market Sentiment Index: BEARISH
17 of the 69 participating brokers, or 24.64% of all participants, registered a positive Net Amount
20 of the 69 participating brokers, or 28.99% of all participants, registered a higher Buying Average than Selling Average
69 Participating Brokers’ Buying Average: ₱10.61208
69 Participating Brokers’ Selling Average: ₱10.58870
7 out of 69 participants, or 10.14% of all participants, registered a 100% BUYING activity
31 out of 69 participants, or 44.93% of all participants, registered a 100% SELLING activity
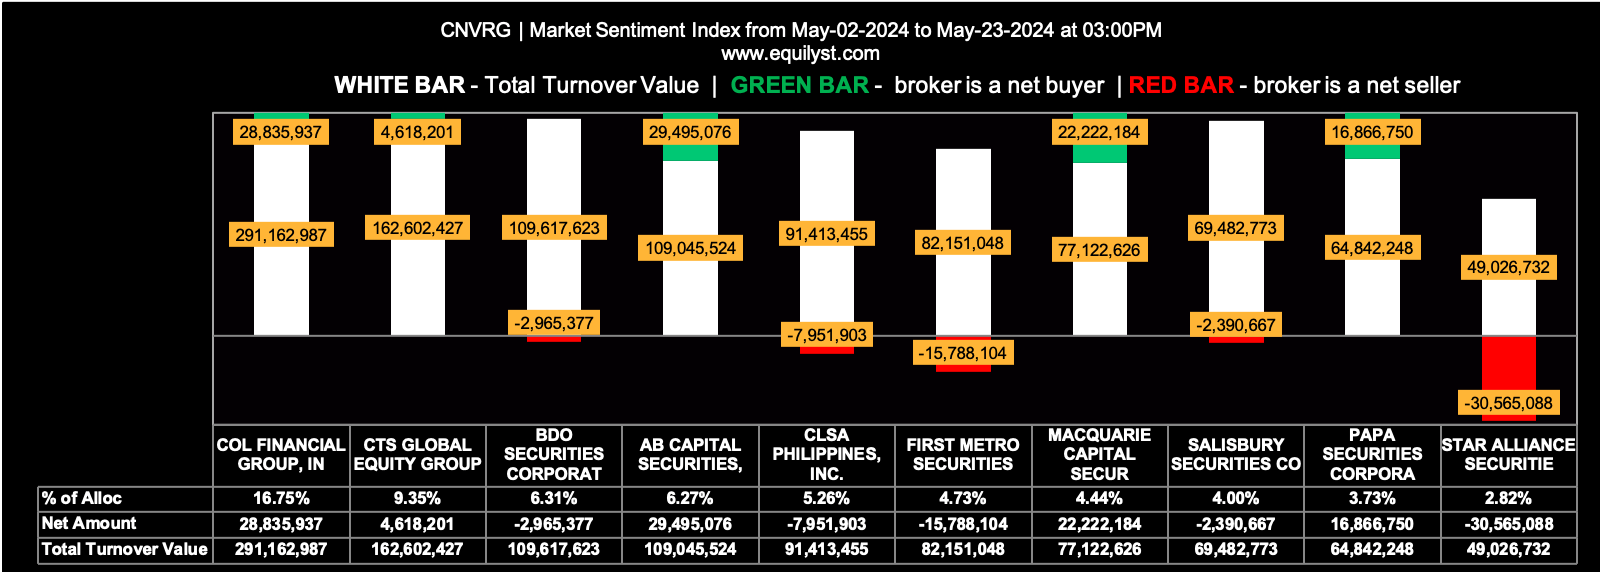
Market Sentiment Index (May 2, 2024 – May 23, 2024): BEARISH
33 of the 91 participating brokers, or 36.26% of all participants, registered a positive Net Amount
28 of the 91 participating brokers, or 30.77% of all participants, registered a higher Buying Average than Selling Average
91 Participating Brokers’ Buying Average: ₱9.52951
91 Participating Brokers’ Selling Average: ₱9.87458
3 out of 91 participants, or 3.30% of all participants, registered a 100% BUYING activity
14 out of 91 participants, or 15.38% of all participants, registered a 100% SELLING activity
Does Not Having a Buy Signal Mean a Sell Signal?
Not having a buy signal can only be a sell signal if, and only if, your trailing stop has already been hit. If your trailing stop is still intact, you can ignore the lack of a buy signal unless both the Dominant Range Index and the EOD Market Sentiment Index have been bearish for three consecutive trading days.
If these two indicators have been bearish for three straight trading days, you may consider preempting your trailing stop even if it has yet to be hit.
Would You Like More?
You may subscribe to my teleconsulting service, stock screener subscription, and premium analysis subscription.
You may also read my other reports here and watch my videos on YouTube.
- MA, BDO, ALI, URC, PX: Is Their Dominant Range Pointing to a Breakout? - March 14, 2025
- Tracking Market Sentiment: MTD Ratings for 30 Bluechip Stocks (March 2025) - March 13, 2025
- PSEi Stalls Below 6,260 as Market Awaits Political Shift - March 12, 2025


