Why Do I Check the Dominant Range Index Rating for a Bluechip or Non-bluechip Stock?
As a computer scientist, I use Nash Equilibrium theory to find the best range of prices for buying or selling shares of a stock. Even if you’re a 10-year-old boy or girl reading this, don’t worry—I’ll explain it in a way you’ll easily understand.
Imagine now that there’s a really popular game that most of the friends want to play. This game is so popular that a lot of friends choose it, and they talk about it all the time. Because it’s the most popular game, more friends watch closely to see if anyone changes their mind about playing it.
In the stock market, the popular game is like the frequently traded prices of stocks. These are the prices where lots of traders are buying and selling, which means there’s a lot of activity, or “volume,” at these prices.
Monitoring these frequently traded prices is important because they show us where the Nash Equilibrium might be. When there are a lot of trades at a certain price, it means many traders agree that this price is fair. It’s like seeing most of the friends happily playing the same game—they’ve reached an agreement and no one wants to change.
If you watch these prices, you can see how the market feels about a stock. If the price stays the same for a while with lots of trades happening, it means the traders are in a Nash Equilibrium. They don’t want to change their buy or sell prices because they think it’s the best decision given what everyone else is doing.
But if the prices start to change a lot, it means traders are changing their minds, just like friends switching to a different game. By monitoring these changes, you can understand when the market is finding a new equilibrium, which is like finding out what the new popular game will be.
So, watching the frequently traded prices helps traders understand where the Nash Equilibrium is and predict where it might go next. This helps them make better decisions about buying and selling stocks.
How Does My Dominant Range Index Come Up with a Rating?
It’s a proprietary model comprised of the volume-weighted average price (VWAP), prevailing price, the proximity of the dominant range to both the intraday high and low, and other parameters. I cannot tell the exact algorithm for obvious reasons.
What’s the Role of the Dominant Range Index in My Decision-Making?
My buying decision has four criteria. Having a bullish Dominant Range Index rating (whether it’s the prevailing rating as trading happens or end-of-day rating) is one of them. I can teach you my entire methodology when you avail yourself of my consulting service.
EOD Dominant Range Index Rating of 7 Philippine Bluechip Stocks That Are More Than 30% Above Their 52-Week Low
Guess how many Philippine bluechip stocks have already advanced by more than 30% above their 52-week low as of the end of trading on June 3, 2024?
Do you expect them to have a bullish Dominant Range Index just because they’re already more than 30% above their 52-week low?
Read and comprehend the information below to discover the answer to those questions.
Wilcon Depot (WLCON)
52-Week Low: P15.30
Current Price: P20.00
Price Improvement from 52-Week Low: 30.72%
Dominant Range Index: BULLISH
Last Price: 20.00
Dominant Range: 19.98 – 20.00
VWAP: 19.96
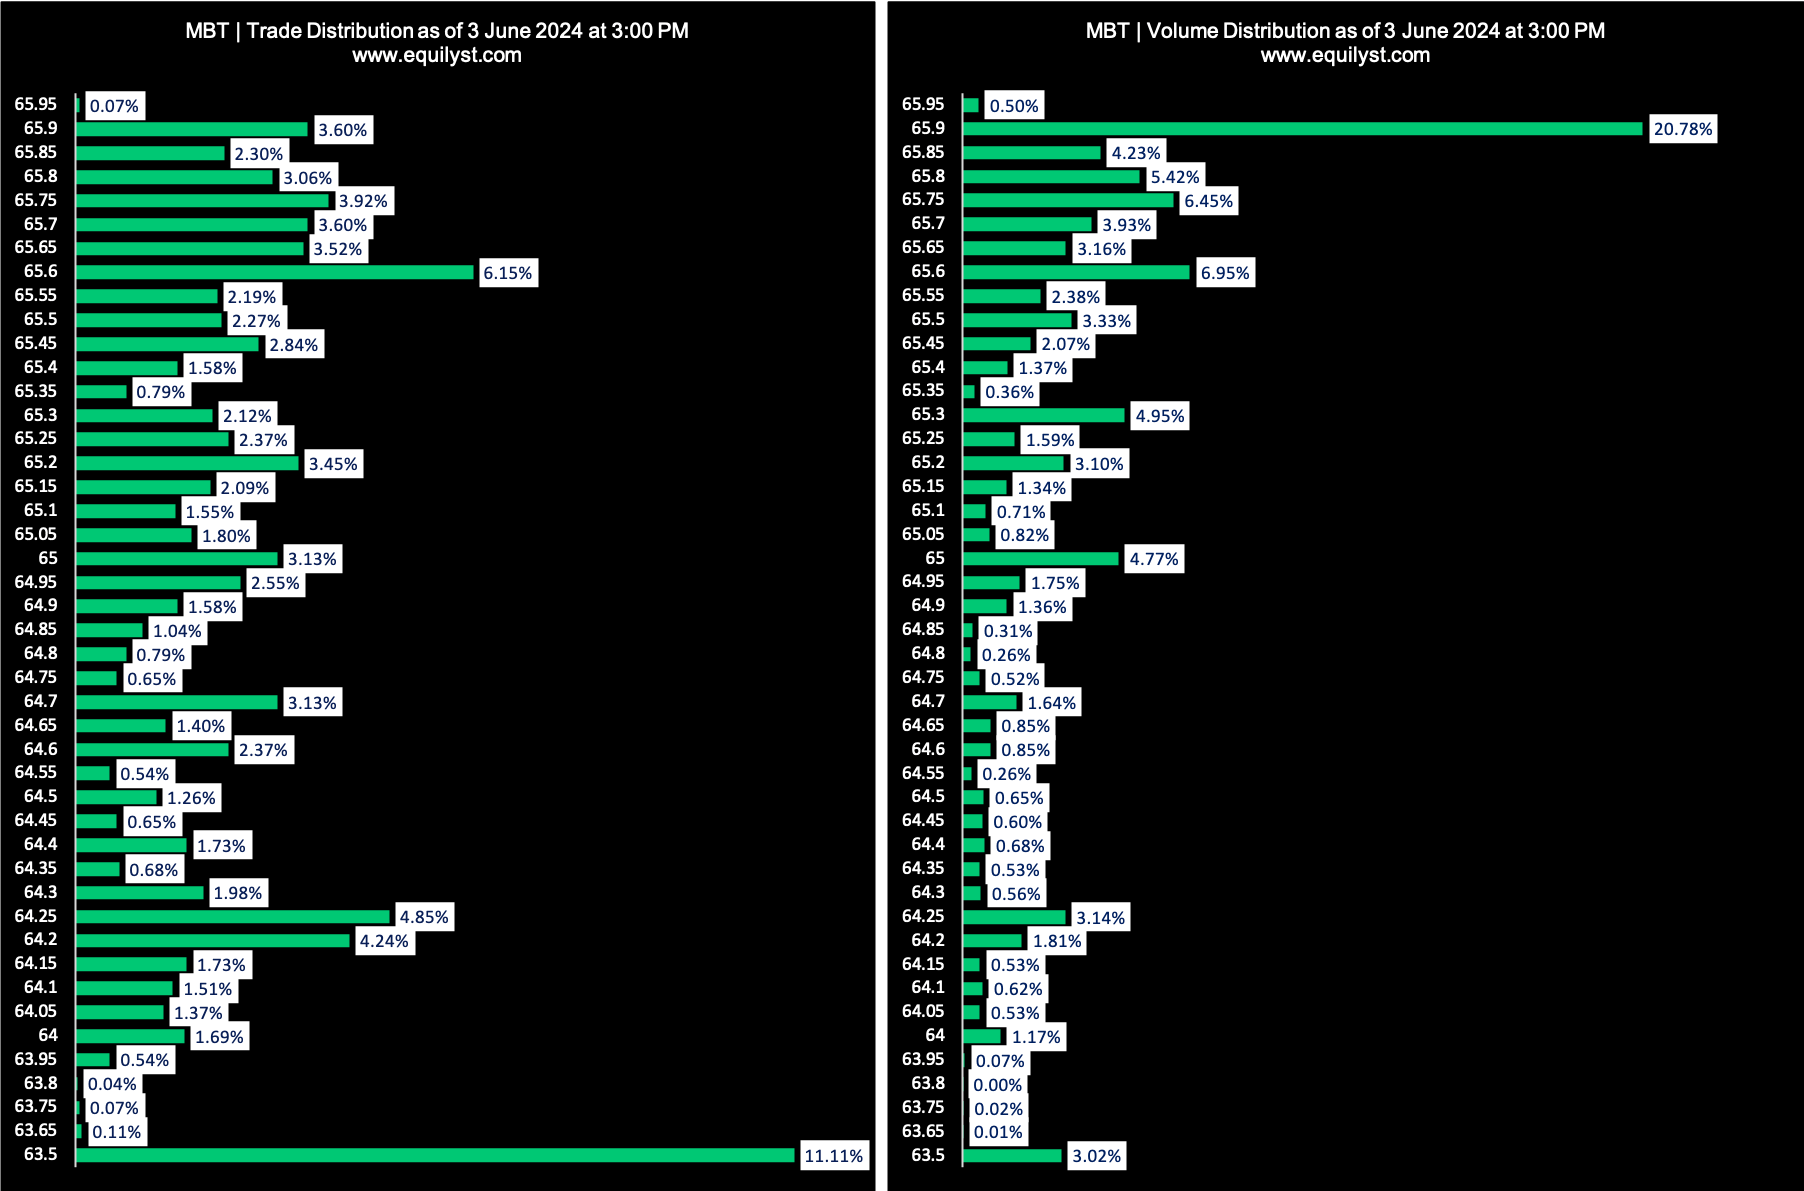
Metropolitan Bank & Trust Company (MBT)
52-Week Low: P49.20
Current Price: P65.90
Price Improvement from 52-Week Low: 33.94%
Dominant Range Index: BULLISH
Last Price: 65.90
Dominant Range: 66.60 – 66.90
VWAP: 65.34
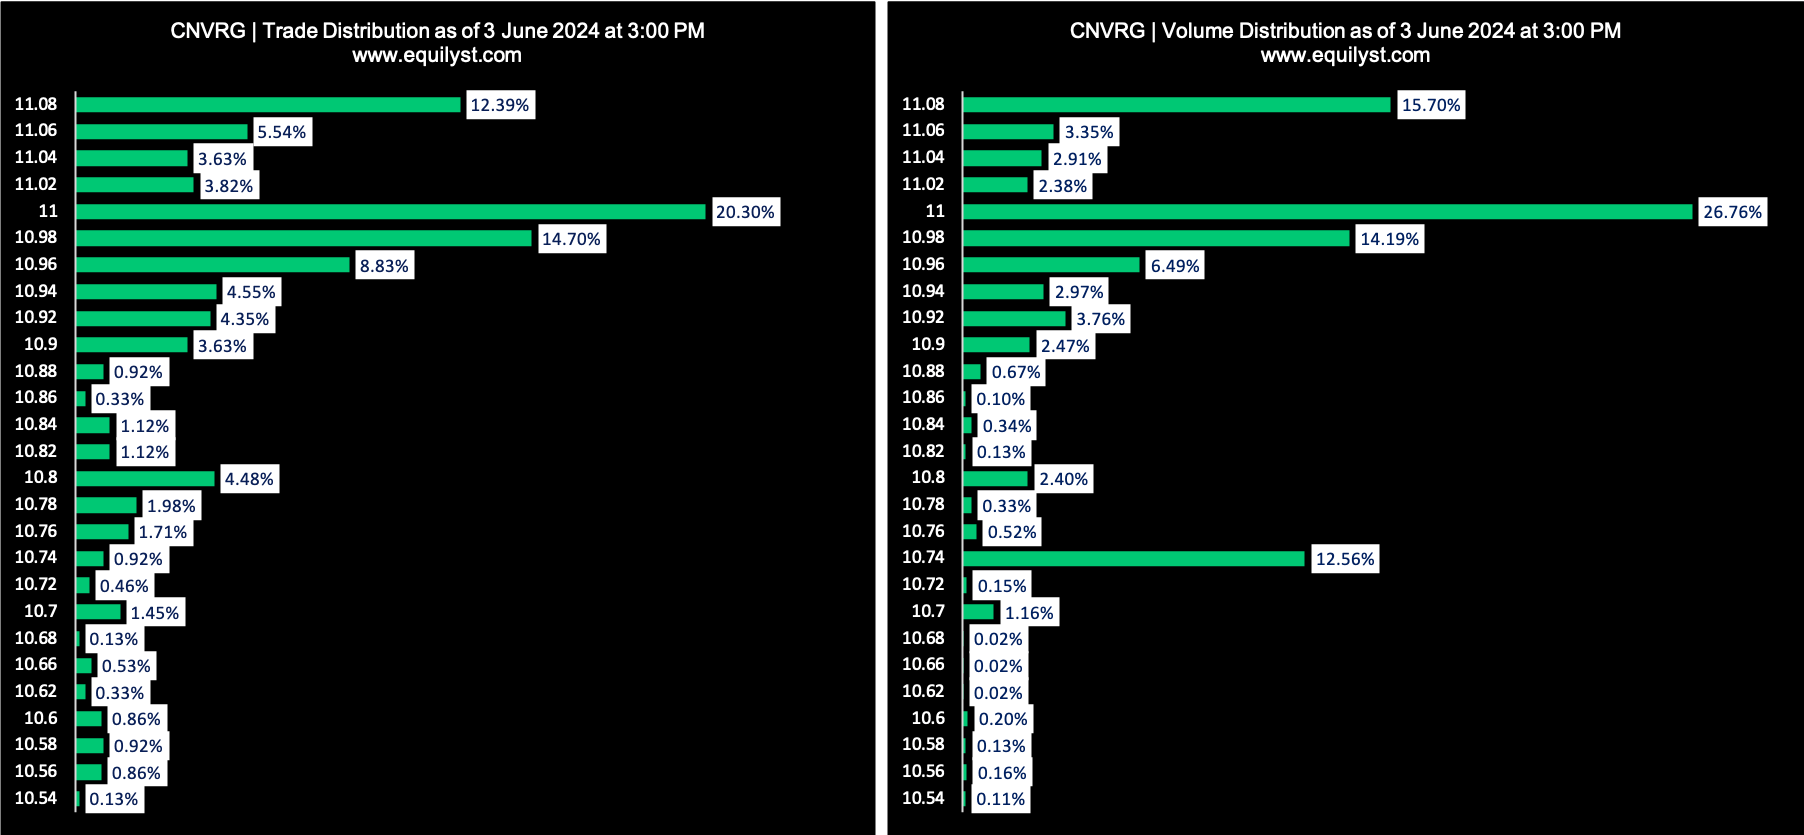
Converge Information and Communications Technology Solutions (CNVRG)
52-Week Low: P7.63
Current Price: P11.08
Price Improvement from 52-Week Low: 45.22%
Dominant Range Index: BULLISH
Last Price: 11.08
Dominant Range: 10.96 – 11.08
VWAP: 10.96
ACEN CORPORATION (ACEN)
52-Week Low: P3.10
Current Price: P4.78
Price Improvement from 52-Week Low: 54.19%
Dominant Range Index: BEARISH
Last Price: 4.78
Dominant Range: 4.74 – 4.79
VWAP: 4.78
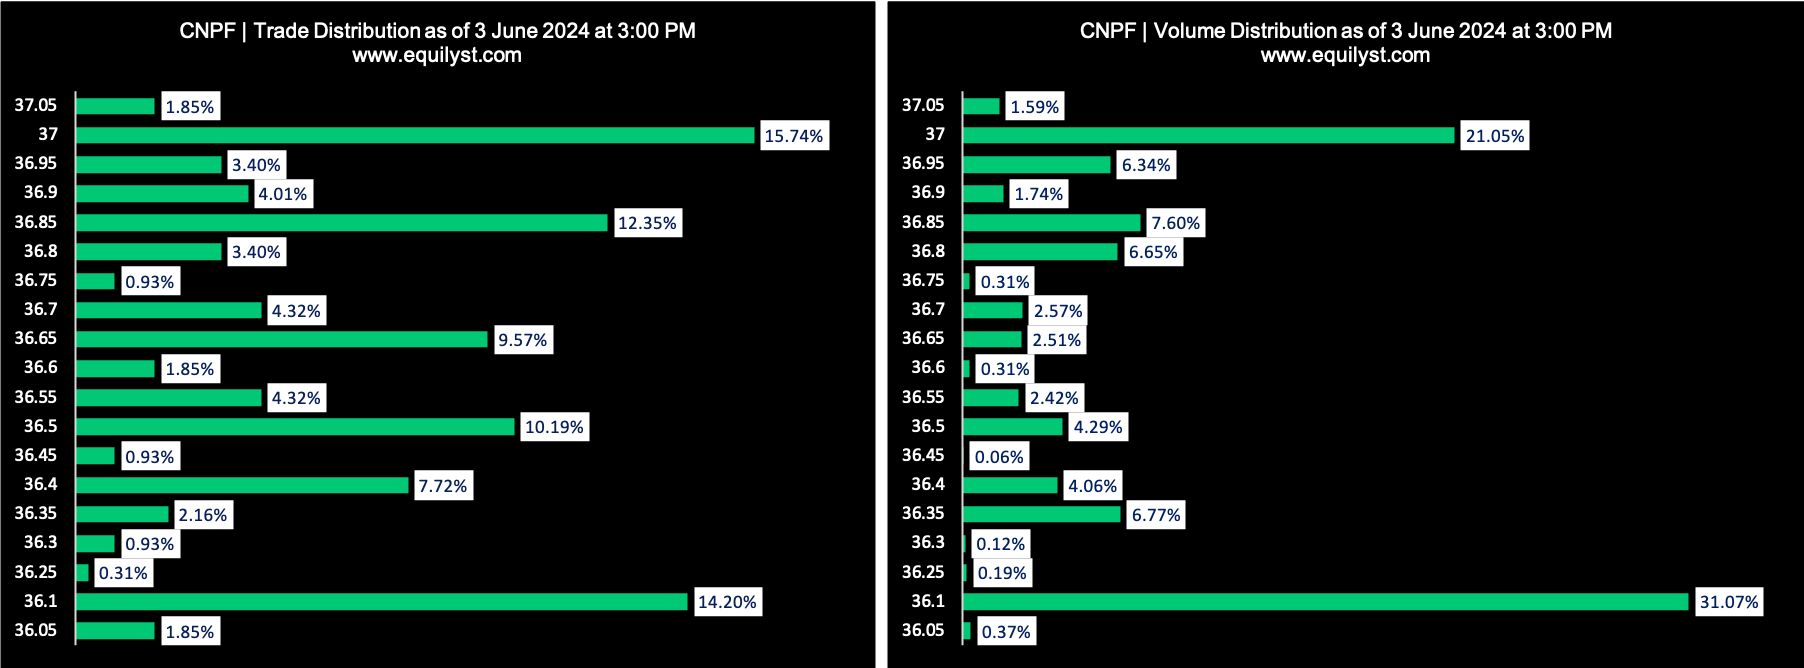
Century Pacific Food (CNPF)
52-Week Low: P23.10
Current Price: P36.10
Price Improvement from 52-Week Low: 56.28%
Dominant Range Index: BEARISH
Last Price: 36.10
Dominant Range: 36.10 – 36.10
VWAP: 36.57
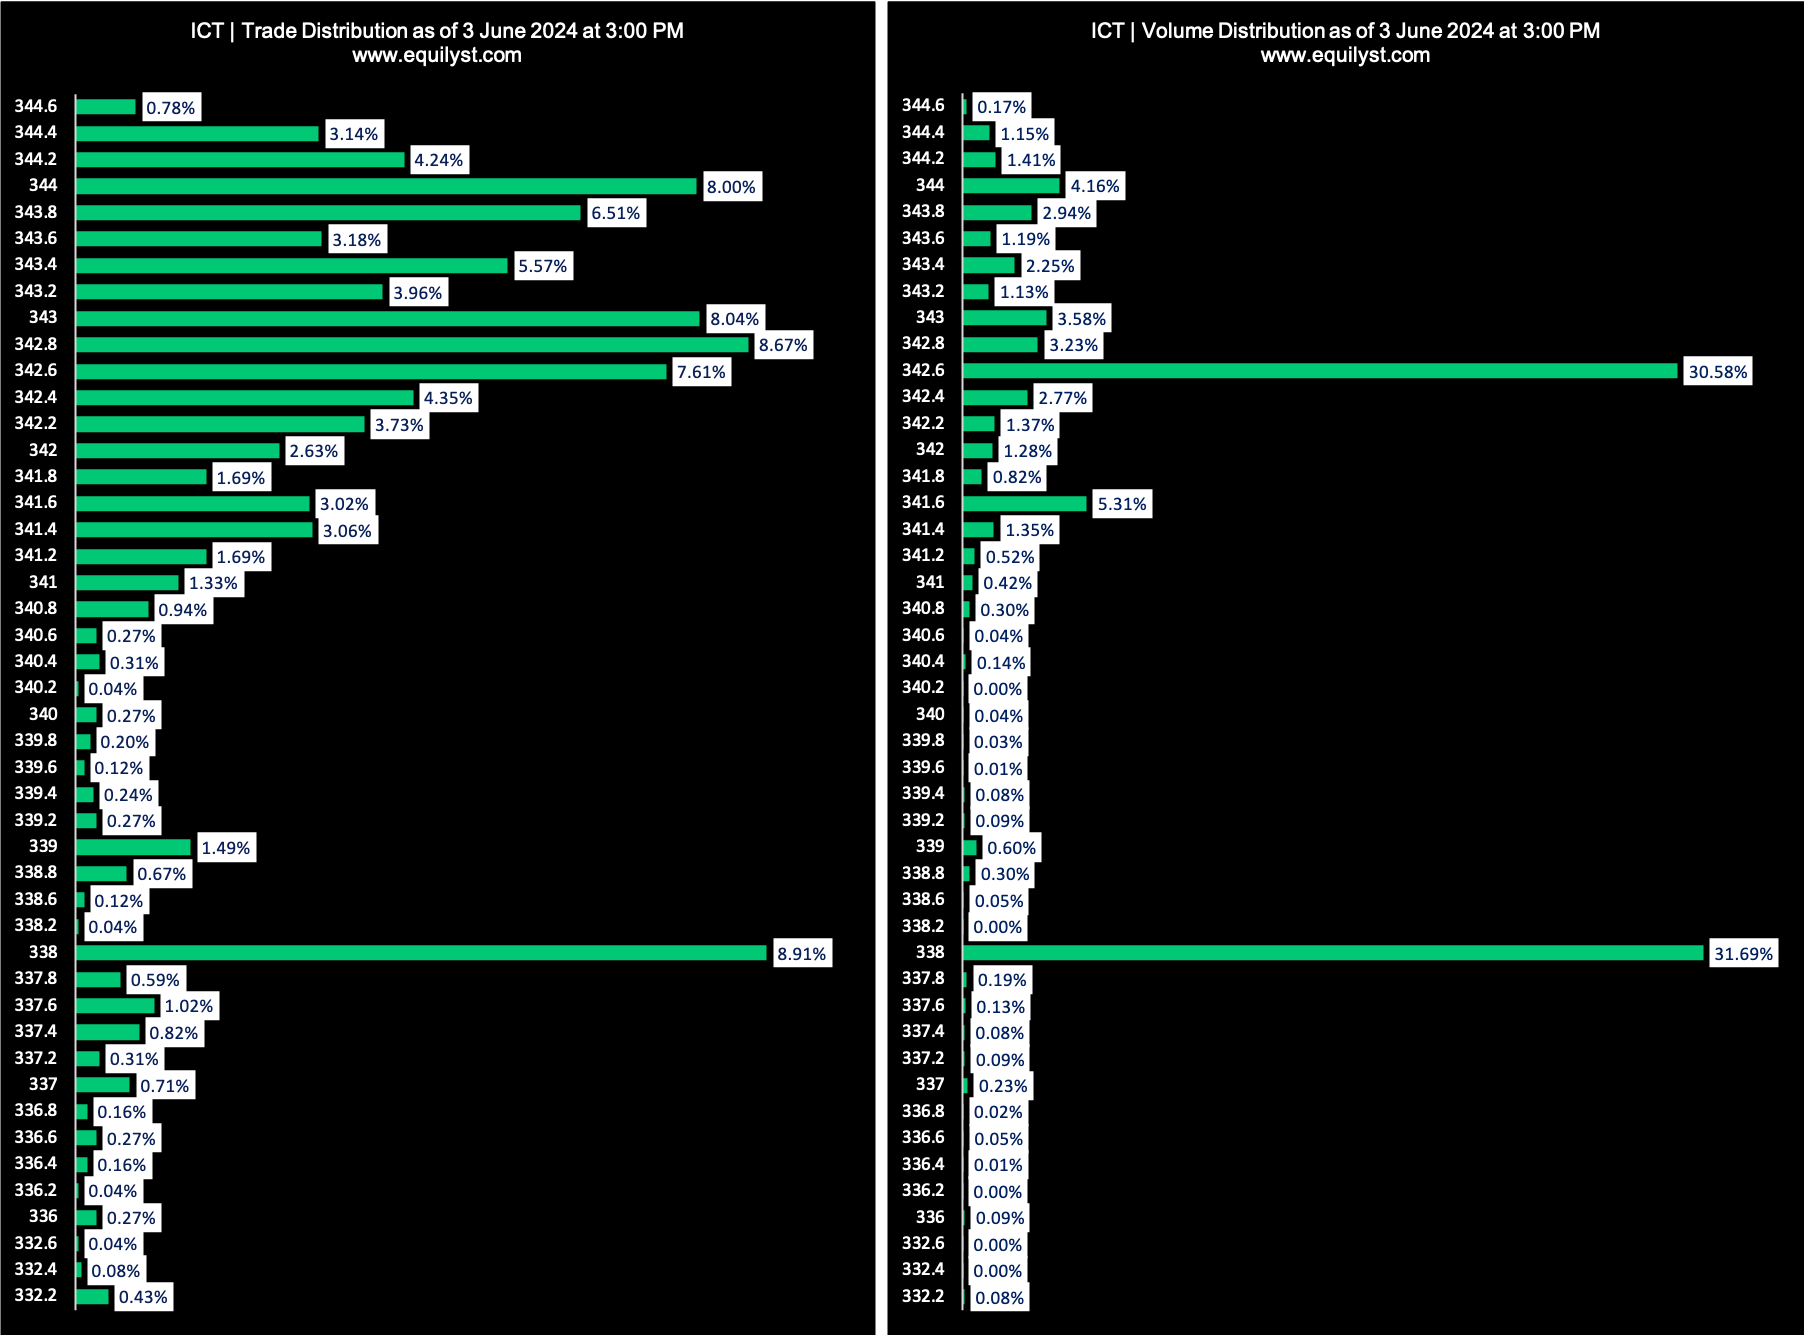
International Container Terminal Services (ICT)
52-Week Low: P191.30
Current Price: P338.00
Price Improvement from 52-Week Low: 76.69%
Dominant Range Index: BEARISH
Last Price: 338.00
Dominant Range: 338.00 – 338.00
VWAP: 341.12
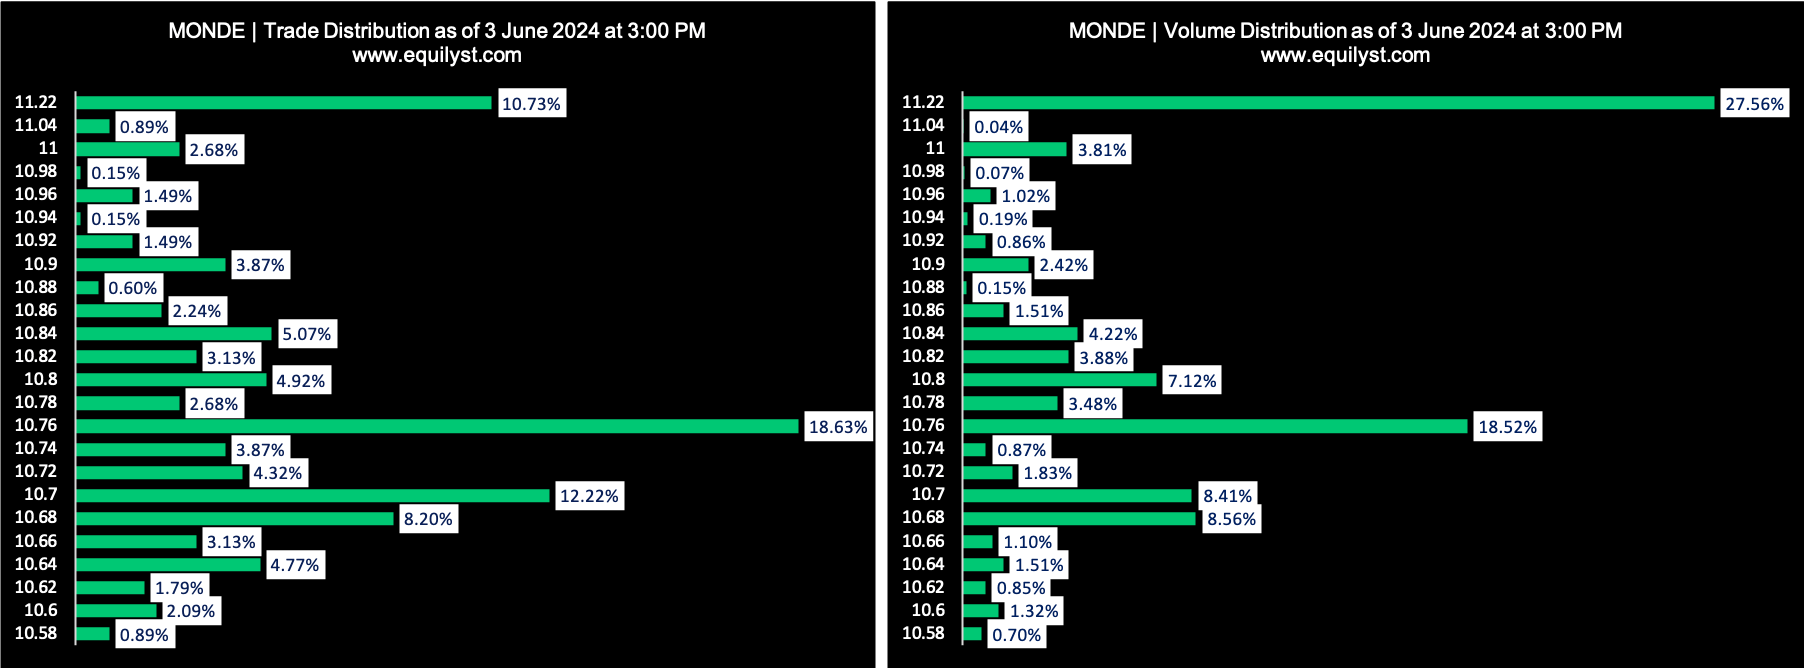
Monde Nissin Corporation (MONDE)
52-Week Low: P6.10
Current Price: P11.22
Price Improvement from 52-Week Low: 83.93%
Dominant Range Index: BULLISH
Last Price: 11.22
Dominant Range: 11.22 – 11.22
VWAP: 10.89
Trade and Invest Smarter with Equilyst Analytics
At Equilyst Analytics, I offer expert consulting, advanced stock screening (list of stocks with a buy signal according to my Evergreen Methodology), and premium stock analysis tailored for both beginners and experienced traders and investors. Enhance your investing strategy with my comprehensive services designed to help you make informed decisions and maximize returns. Click the SERVICES menu on my website and elevate your trading success!
- MA, BDO, ALI, URC, PX: Is Their Dominant Range Pointing to a Breakout? - March 14, 2025
- Tracking Market Sentiment: MTD Ratings for 30 Bluechip Stocks (March 2025) - March 13, 2025
- PSEi Stalls Below 6,260 as Market Awaits Political Shift - March 12, 2025


