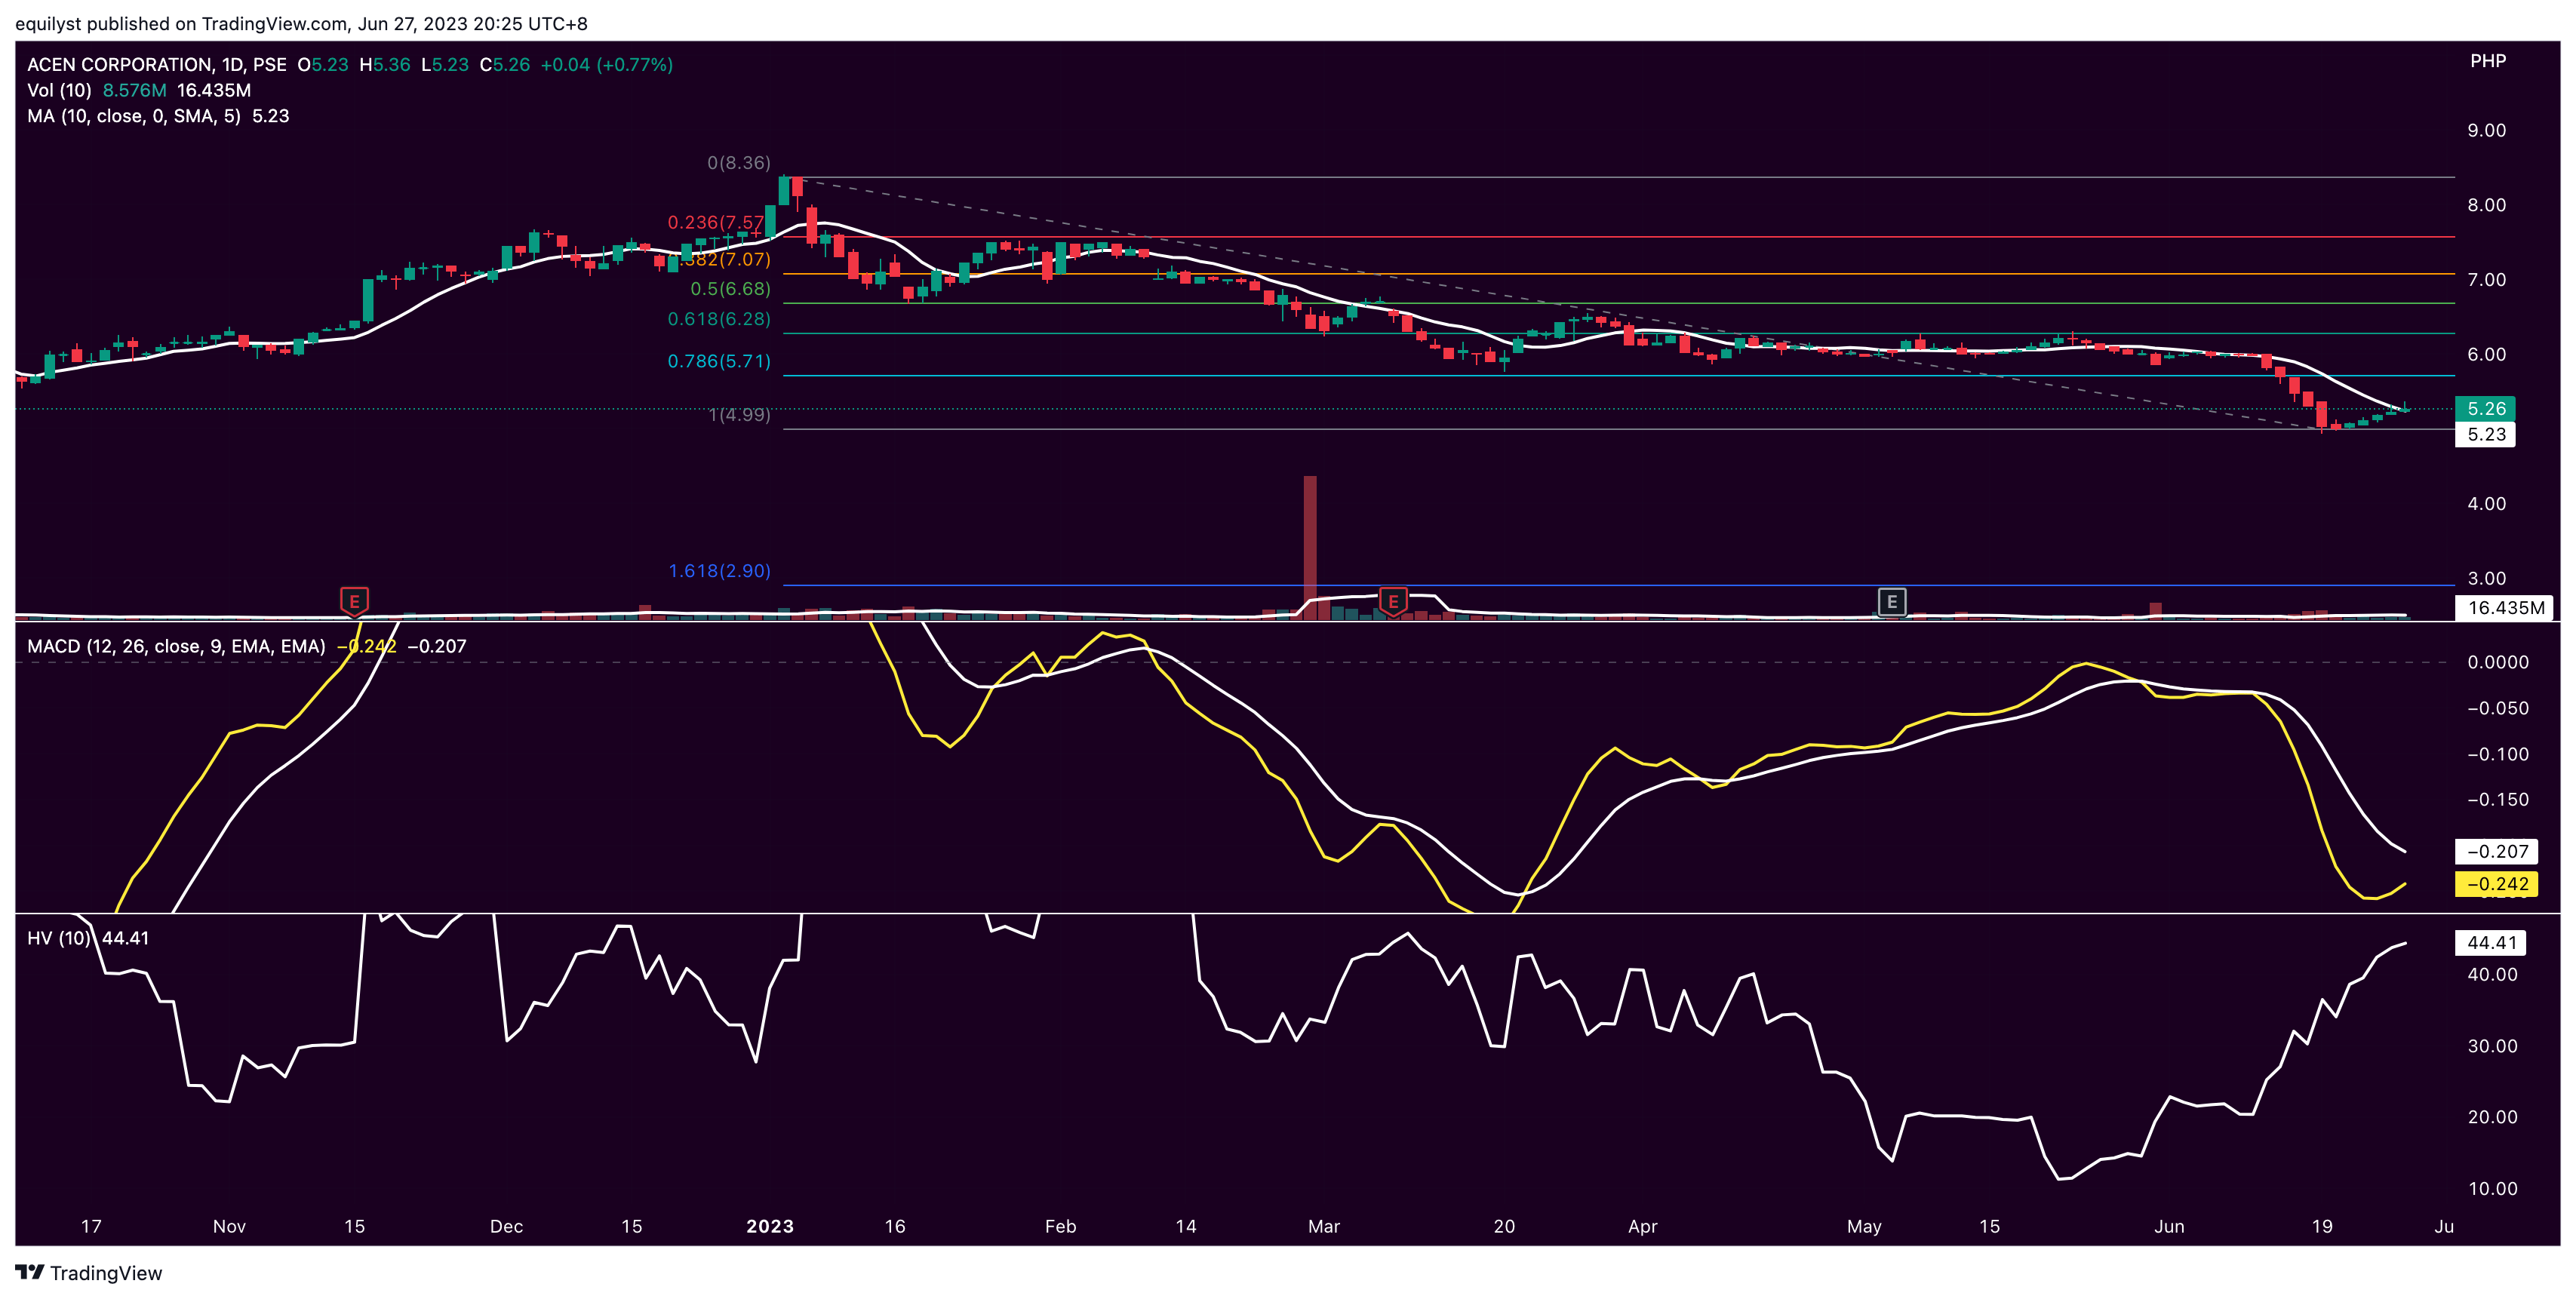
ACEN Corporation (PSE:ACEN) closed on Tuesday, June 27, 2023, at P5.26 per share, advanced by 0.77%, but declined by 30.97% year-to-date.
PSE: ACEN broke out from the said moving average today after trading below its 10-day simple moving average for 10 consecutive trading days.
Despite the breakout, today’s closing price is lower than ACEN’s volume-weighted average price of P5.29.
Is that a bad situation?
I’ll explain.
A higher closing price suggests upward momentum and a positive sentiment among investors.
When the closing price is higher than the VWAP, it often indicates strong demand for the stock toward the end of the trading day. This suggests buyers were more aggressive, leading to a higher closing price.
It can be seen as a positive sign, reflecting increased buying pressure and potential market strength.
However, you shouldn’t rely on this indicator alone. You’ll see in this analysis the other data sets and indicators I use to develop a data-driven forecast.
READ: ACEN and SUPER Forge Strategic Partnership for Solar Power Ventures
ACEN’s support is pegged at P5.00 while resistance is at P5.70, aligned with the 78.6% Fibonacci retracement.
Daily volume for the past two trading days is more than 50% of ACEN’s 10-day volume average. The preference is to see volume above 100% of its volume average for a stronger upward momentum.
While ACEN’s moving average convergence divergence (MACD) is still traversing below the signal line, it has already bent upward, starting a bullish convergence with the signal line. A golden cross above the signal line will likely happen once the current price breaks above the resistance at P5.70.
Meanwhile, the 10-day historical volatility of ACEN imposes a low risk level since it’s still below 50%. Thanks to the lack of huge price gaps and engulfing candlesticks.
Trade-Volume Distribution Analysis
ACEN’s dominant range, including its VWAP, is closer to the intraday low than the intraday high.
Doesn’t that explain why the volume, despite being green, never exceeded 100% of the stock’s 10-day volume average for the past five consecutive trading days?
Does this mean some traders are selling on strength?
Think about it.
Dominant Range Index: BEARISH
Last Price: 5.26
VWAP: 5.29
Dominant Range: 5.29 – 5.3
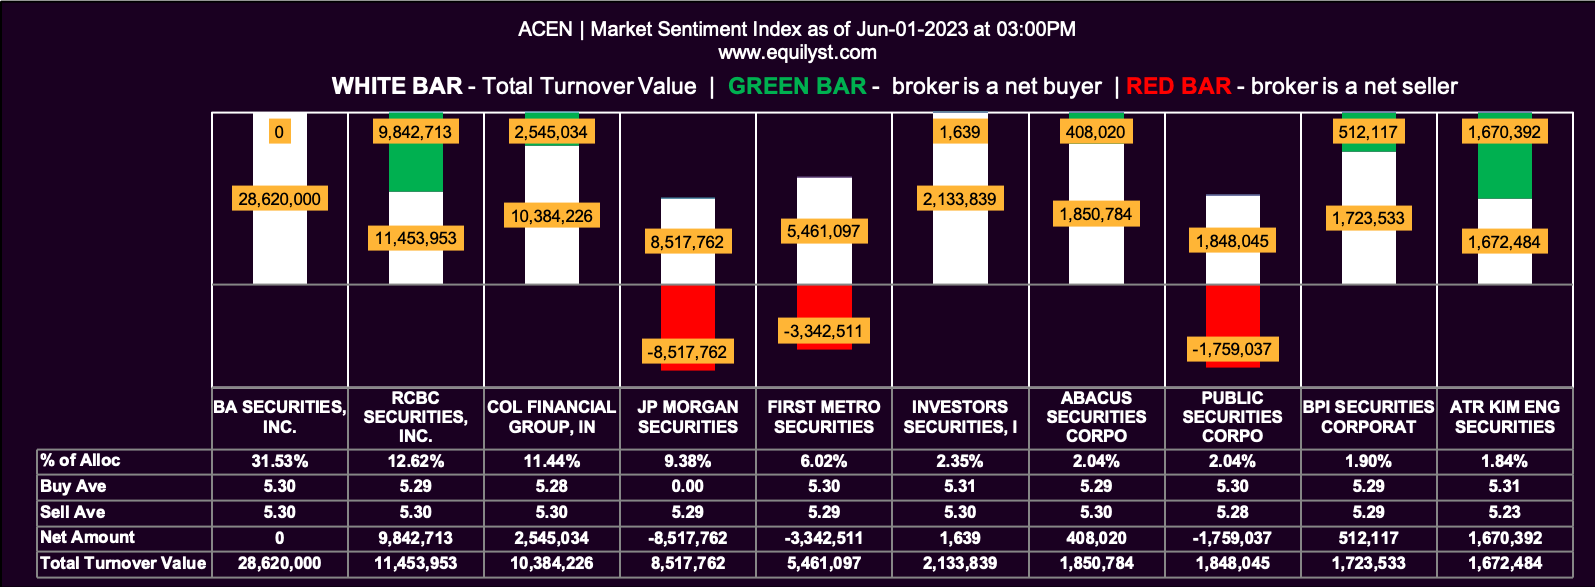
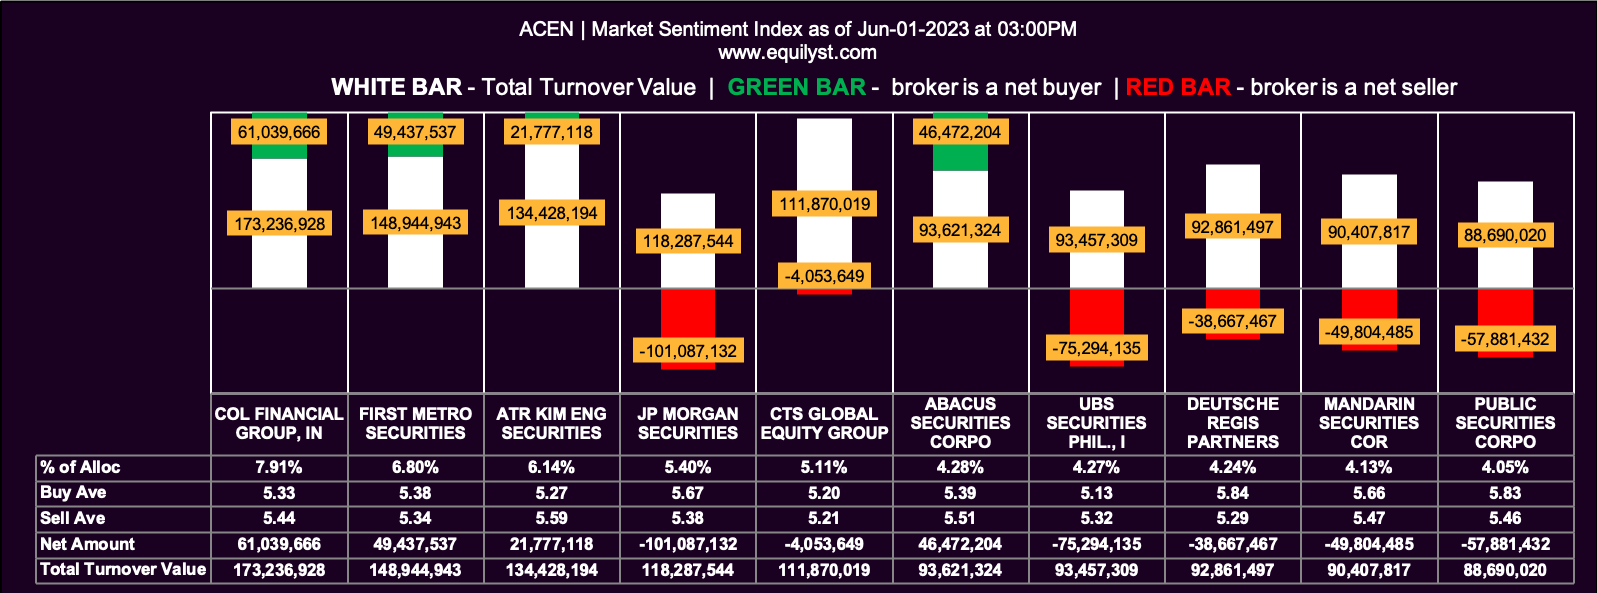
Notice the contrarian take of the market sentiment, end-of-day and month-to-date, on ACEN.
I observed lots of bearish signals above. But the market sentiment for the two periods is bullish.
Who do you think is more confident to buy the dips: the new entrants or those with huge unrealized losses on ACEN?
Let me know in the comments.
Market Sentiment Analysis
Market Sentiment Index (June 27, 2023): BULLISH
30 of the 50 participating brokers, or 60.00% of all participants, registered a positive Net Amount
23 of the 50 participating brokers, or 46.00% of all participants, registered a higher Buying Average than Selling Average
50 Participating Brokers’ Buying Average: ₱5.29083
50 Participating Brokers’ Selling Average: ₱5.29362
14 out of 50 participants, or 28.00% of all participants, registered a 100% BUYING activity
15 out of 50 participants, or 30.00% of all participants, registered a 100% SELLING activity
Market Sentiment Index (June 1, 2023 to June 27, 2023): BULLISH
76 of the 101 participating brokers, or 75.25% of all participants, registered a positive Net Amount
56 of the 101 participating brokers, or 55.45% of all participants, registered a higher Buying Average than Selling Average
101 Participating Brokers’ Buying Average: ₱5.34186
101 Participating Brokers’ Selling Average: ₱5.37815
17 out of 101 participants, or 16.83% of all participants, registered a 100% BUYING activity
1 out of 101 participants, or 0.99% of all participants, registered a 100% SELLING activity
Does ACEN Have a Buy Signal?
Using my Evergreen Strategy as the basis, there’s yet to be a confirmed buy signal for ACEN. The odds are still in favor of the bears. Not all indicators of my methodology have been satisfied.
The daily green candlesticks of ACEN must be accompanied with, preferably, volume above 100% of the stock’s 10-day volume average for the ascent to be sustainable.
Otherwise, the majority will sell and not buy on the breakout from the resistance.
If you already have a position on ACEN and your trailing stop is still intact, consider erring on the side of caution by holding your position. If you have enough buying power to top up or average down, do it once there’s a confirmed buy signal.
If you don’t have a position on ACEN yet, I’d give the same advice – wait for a confirmed buy signal. You’ll most likely get a confirmed buy signal once the price breaks above the immediate resistance. That’ll also give you a more attractive reward-to-risk ratio once the buy signal is spotted on a breakout.
If you want to know more about my methodology, I invite you to be a TITANIUM client of Equilyst Analytics.
Would you like a receive an analysis that is more in-depth than this? Our PLATINUM clients can request our in-depth analysis with recommendations relative to their position on the stock.
- MA, BDO, ALI, URC, PX: Is Their Dominant Range Pointing to a Breakout? - March 14, 2025
- Tracking Market Sentiment: MTD Ratings for 30 Bluechip Stocks (March 2025) - March 13, 2025
- PSEi Stalls Below 6,260 as Market Awaits Political Shift - March 12, 2025


