In this report, I’ll show you the results of my trade and volume analysis and market sentiment analysis for the five stocks with the most viewed disclosures on edge.pse.com.ph.
I do trade-volume analysis to see if the price range that has the biggest volume and highest number of trades is closer to the intraday high than the intraday low. Here are some of the ways on how I interpret it:
- If the last price has a positive day change and the dominant range is closer to the intraday high than the intraday low, it means the ascent in price is more likely to continue.
- If the last price has a negative day change and the dominant range is closer to the intraday high than the intraday low, it means there’s a developing bullish momentum that, perhaps, only requires a bigger volume.
- If the last price has a positive day change and the dominant range is closer to the intraday low than the intraday high, it means the ascent in price is probably inorganic. The price may retreat any time soon.
- If the last price has a negative day change and the dominant range is closer to the intraday low than the intraday high, it means the price may continue its descent.
These are just few of the many factors that form the bearish or bullish rating of my Dominant Range Index for any stock.
On the other hand, I do market sentiment analysis to get the answer to these questions:
- How many participating brokers have recorded a positive Net Amount?
- How many participating brokers have registered a higher buying average compared to the selling average?
- What are the average buying and selling amounts across all participating brokers?
- How many participating brokers have engaged in 100% buying and selling activity?
The answers to these questions will form the bearish or bullish rating of my Market Sentiment Index for any stock.
I discuss everything in my exclusive online training with those who avail of the GOLD package of Equilyst Analytics’ stock market consultancy service. It is in that training where I discuss how to use the results in doing an informed buying and selling decision.
Now that I’ve introduced why I do trade-volume analysis and market sentiment analysis, I’ll now share with you the status of the Dominant Range Index and Market Sentiment Index of the five most viewed disclosures as of the date indicated on the charts below.
SP New Energy Corporation (SPNEC)
Dominant Range Index: BULLISH
Last Price: 1.46
VWAP: 1.46
Dominant Range: 1.46 – 1.46
Market Sentiment Index: BULLISH
1 of the 2 participating brokers, or 50.00% of all participants, registered a positive Net Amount
1 of the 2 participating brokers, or 50.00% of all participants, registered a higher Buying Average than Selling Average
2 Participating Brokers’ Buying Average: ₱1.46000
2 Participating Brokers’ Selling Average: ₱1.46000
1 out of 2 participants, or 50.00% of all participants, registered a 100% BUYING activity
1 out of 2 participants, or 50.00% of all participants, registered a 100% SELLING activity
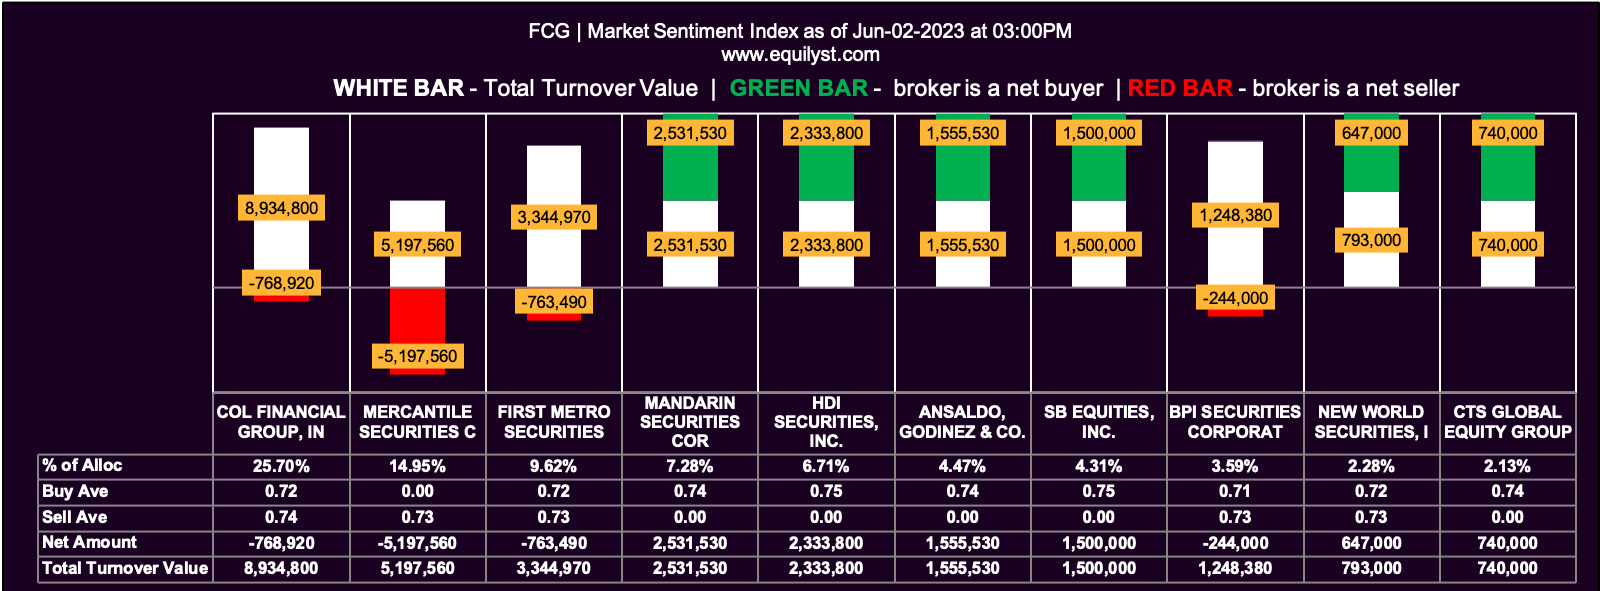
Figaro Coffee Group (FCG)
Dominant Range Index: BULLISH
Last Price: 0.74
VWAP: 0.73
Dominant Range: 0.74 – 0.75
Market Sentiment Index: BEARISH
14 of the 38 participating brokers, or 36.84% of all participants, registered a positive Net Amount
12 of the 38 participating brokers, or 31.58% of all participants, registered a higher Buying Average than Selling Average
38 Participating Brokers’ Buying Average: ₱0.72423
38 Participating Brokers’ Selling Average: ₱0.73195
10 out of 38 participants, or 26.32% of all participants, registered a 100% BUYING activity
14 out of 38 participants, or 36.84% of all participants, registered a 100% SELLING activity
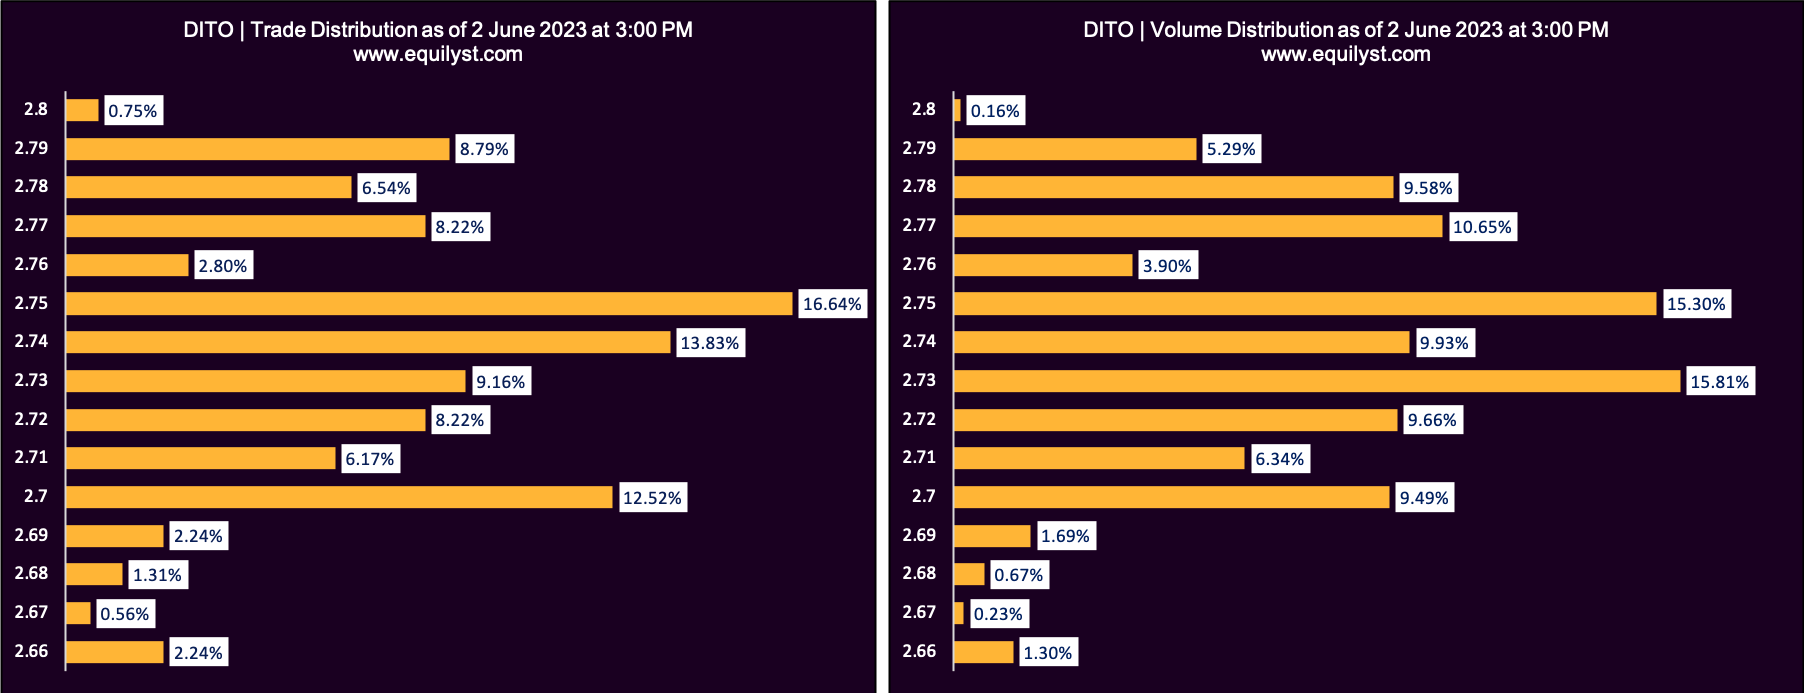
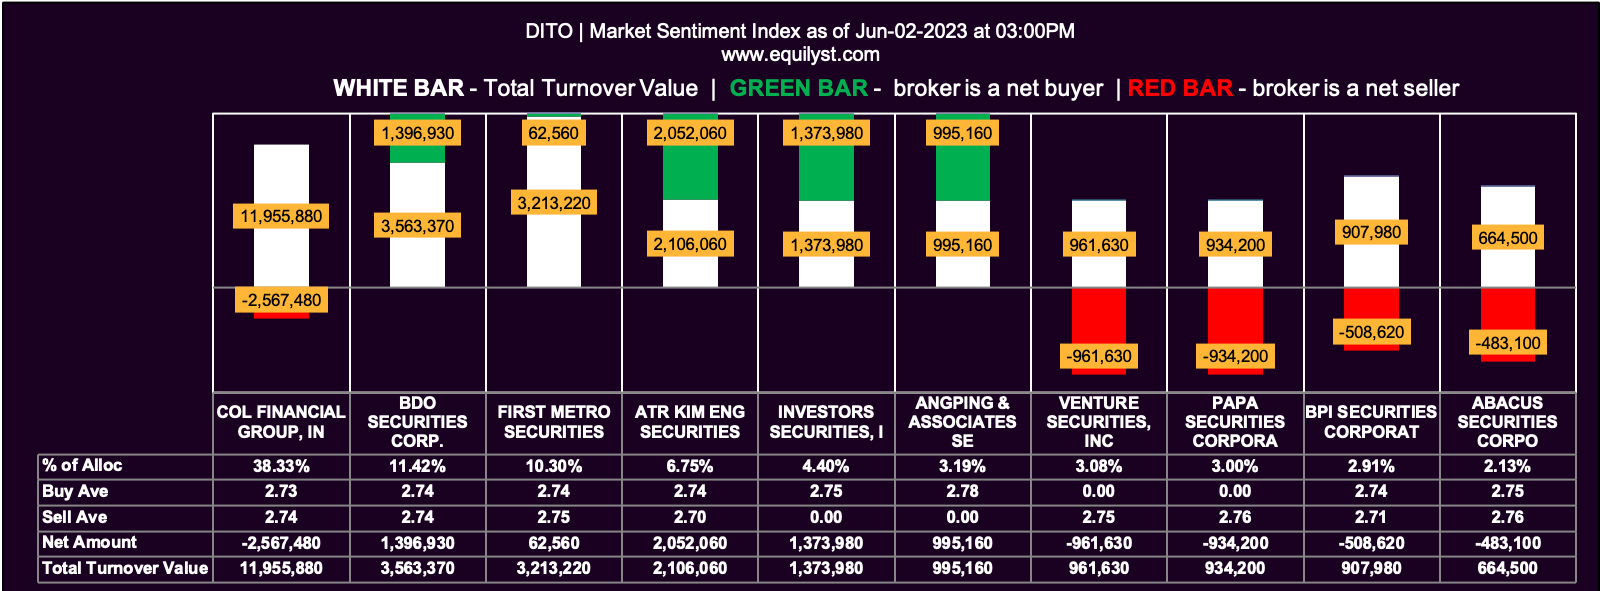
DITO CME Holdings Corp. (DITO)
Dominant Range Index: BULLISH
Last Price: 2.75
VWAP: 2.74
Dominant Range: 2.73 – 2.75
Market Sentiment Index: BULLISH
12 of the 33 participating brokers, or 36.36% of all participants, registered a positive Net Amount
11 of the 33 participating brokers, or 33.33% of all participants, registered a higher Buying Average than Selling Average
33 Participating Brokers’ Buying Average: ₱2.74228
33 Participating Brokers’ Selling Average: ₱2.74035
5 out of 33 participants, or 15.15% of all participants, registered a 100% BUYING activity
15 out of 33 participants, or 45.45% of all participants, registered a 100% SELLING activity
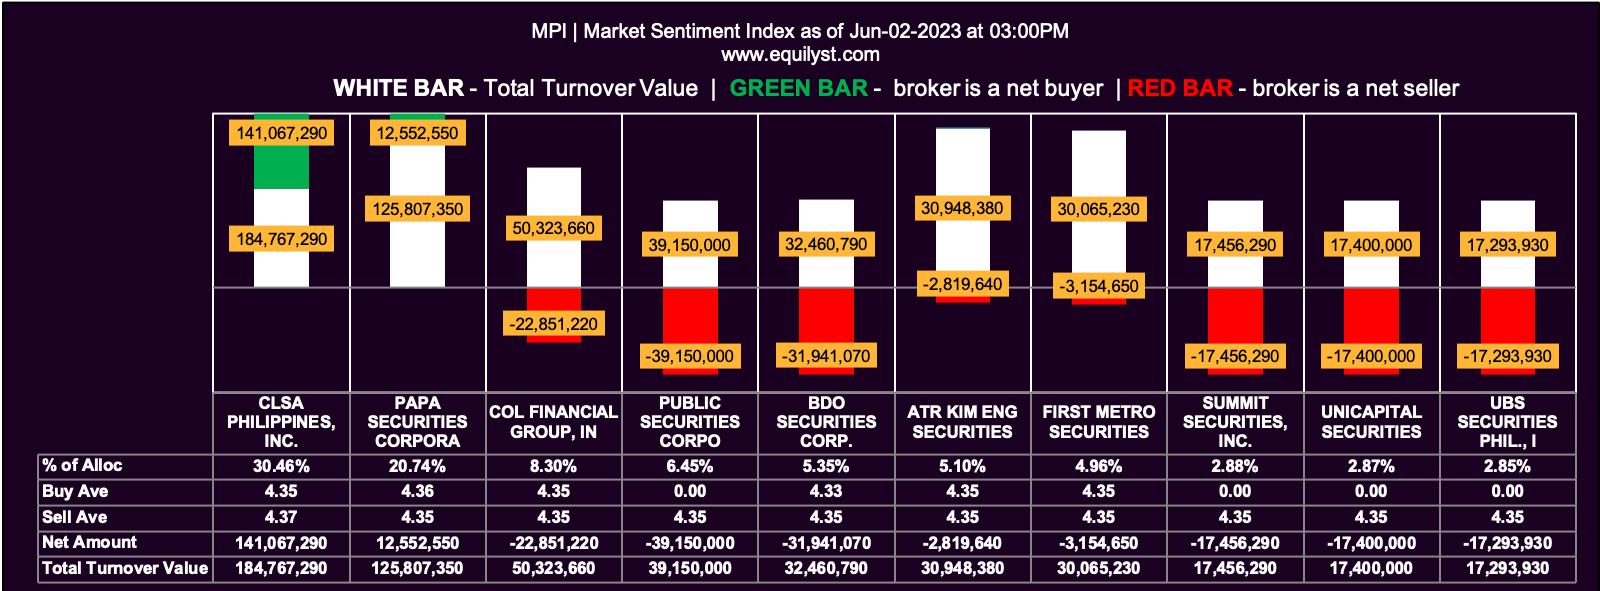
Metro Pacific Investments Corporation (MPI)
Dominant Range Index: BEARISH
Last Price: 4.35
VWAP: 4.35
Dominant Range: 4.35 – 4.35
Market Sentiment Index: BULLISH
21 of the 38 participating brokers, or 55.26% of all participants, registered a positive Net Amount
20 of the 38 participating brokers, or 52.63% of all participants, registered a higher Buying Average than Selling Average
38 Participating Brokers’ Buying Average: ₱4.34848
38 Participating Brokers’ Selling Average: ₱4.35389
10 out of 38 participants, or 26.32% of all participants, registered a 100% BUYING activity
8 out of 38 participants, or 21.05% of all participants, registered a 100% SELLING activity
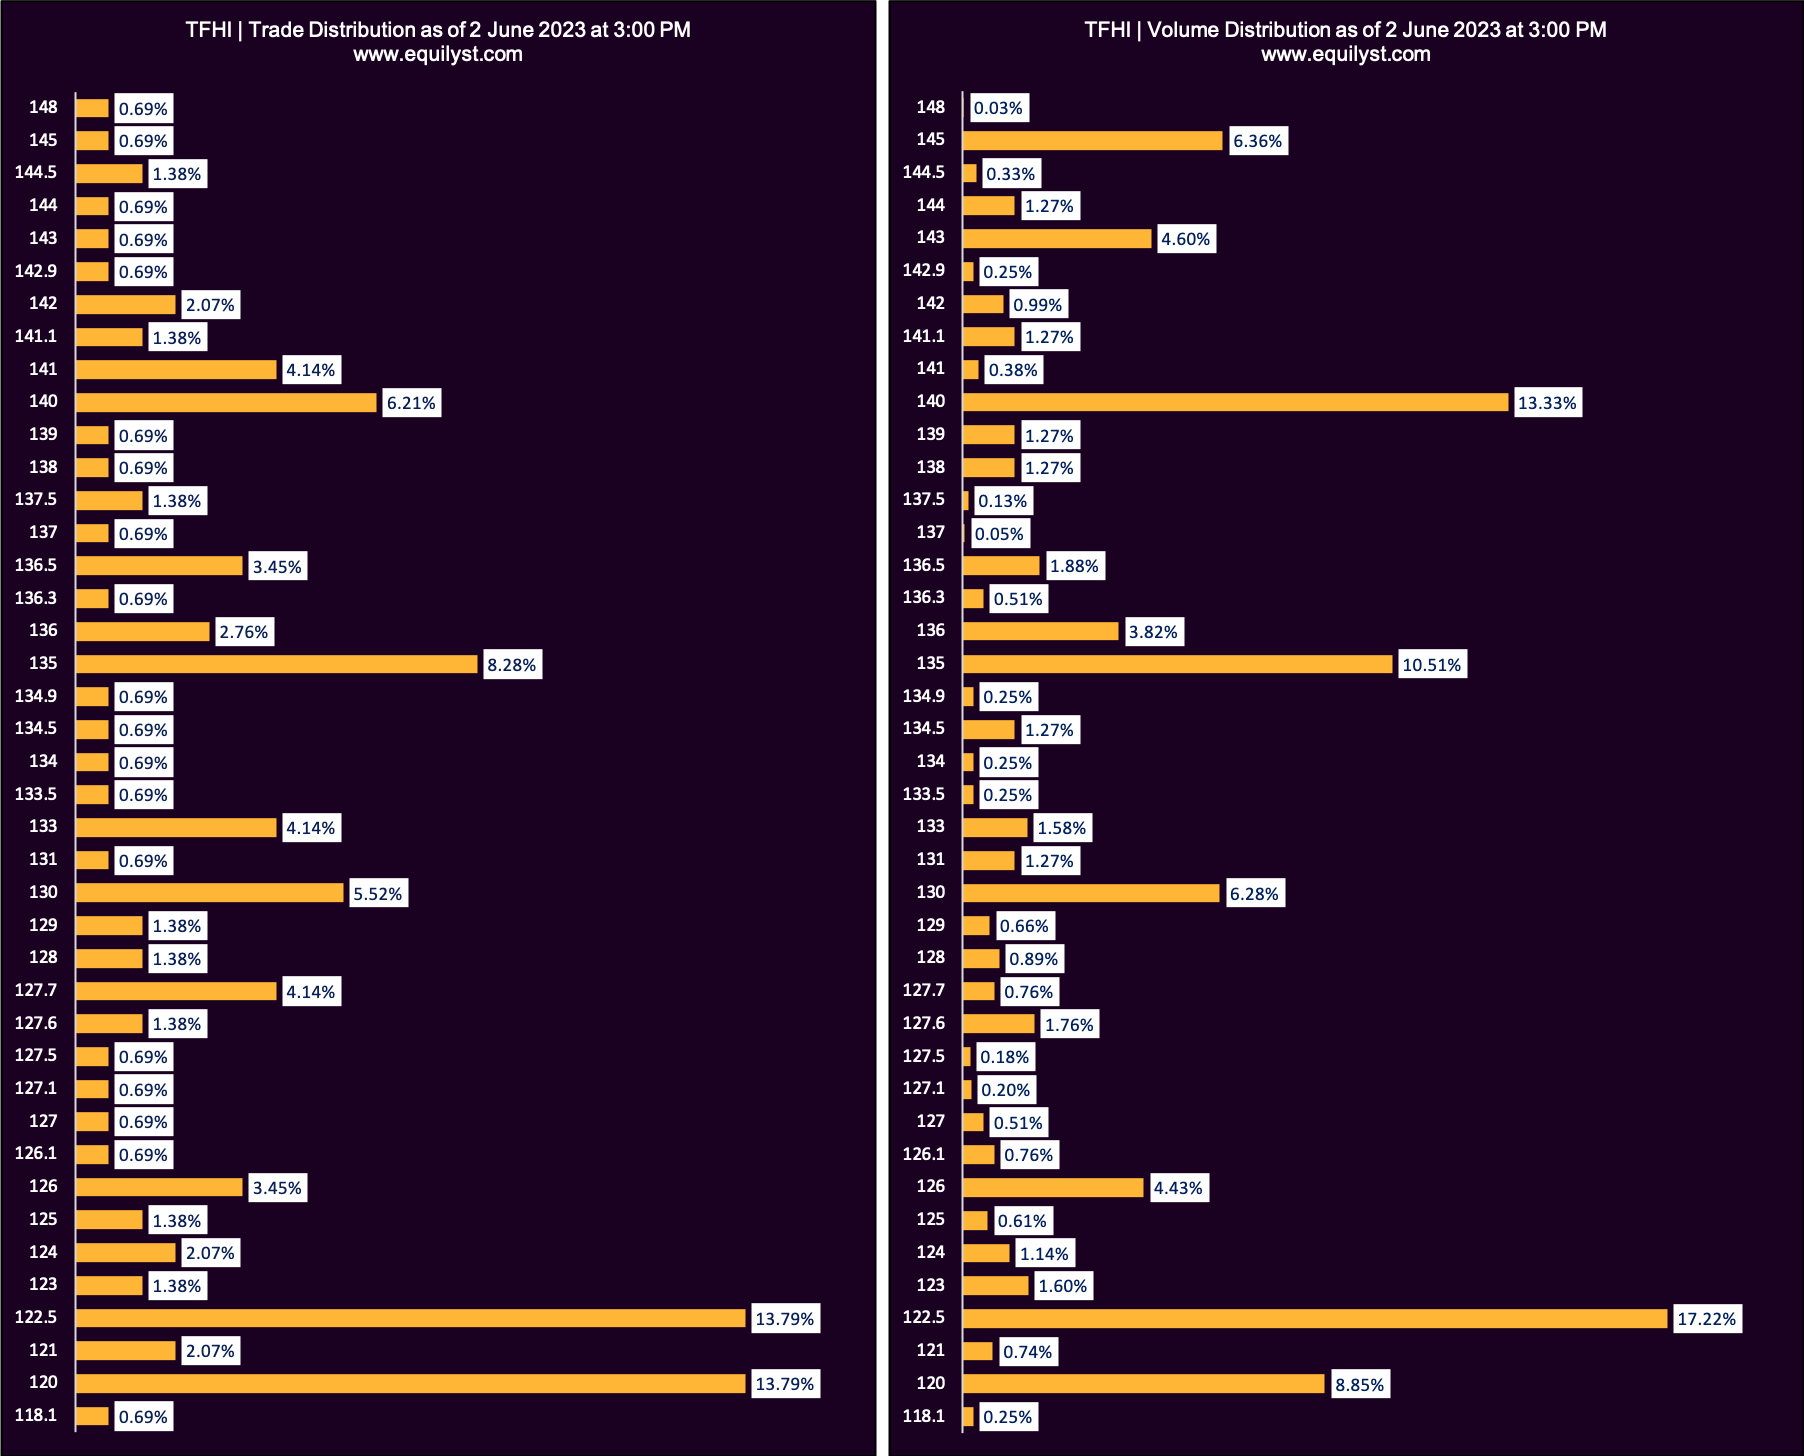
Top Frontier Investment Holdings (TFHI)
Dominant Range Index: BEARISH
Last Price: 120
VWAP: 131.94
Dominant Range: 120 – 122.5
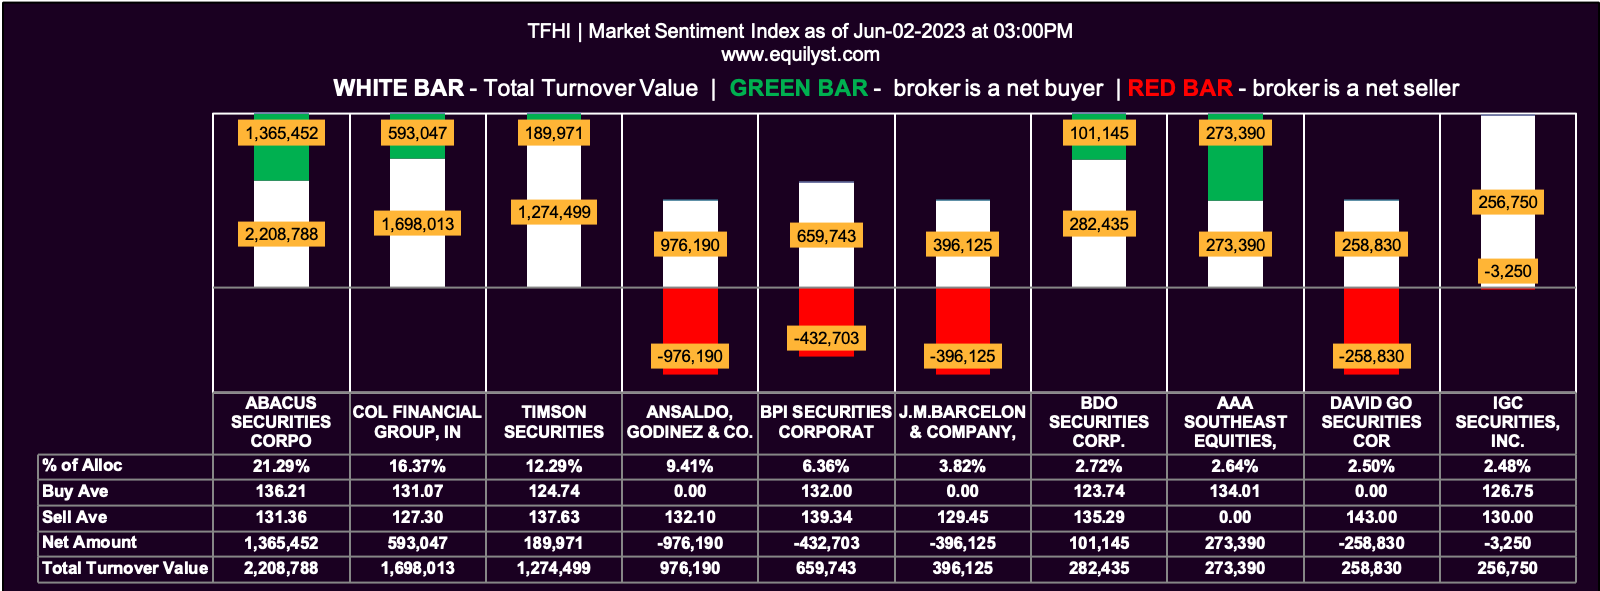
Market Sentiment Index: BULLISH
16 of the 37 participating brokers, or 43.24% of all participants, registered a positive Net Amount
14 of the 37 participating brokers, or 37.84% of all participants, registered a higher Buying Average than Selling Average
37 Participating Brokers’ Buying Average: ₱130.14007
37 Participating Brokers’ Selling Average: ₱128.90202
8 out of 37 participants, or 21.62% of all participants, registered a 100% BUYING activity
18 out of 37 participants, or 48.65% of all participants, registered a 100% SELLING activity
Need a Trade and Investment Coach?
With a track record since 2012, we have effectively supported over 10,000 clients, encompassing both local and international investors, in achieving mastery in independent investing and strategic trading on the Philippine Stock Exchange. See the packages of Equilyst Analytics here.
- MA, BDO, ALI, URC, PX: Is Their Dominant Range Pointing to a Breakout? - March 14, 2025
- Tracking Market Sentiment: MTD Ratings for 30 Bluechip Stocks (March 2025) - March 13, 2025
- PSEi Stalls Below 6,260 as Market Awaits Political Shift - March 12, 2025


