It’s been a while since I’ve published free reports highlighting the usefulness of my proprietary Market Sentiment Index indicator.
Today, I’d like to re-introduce my proprietary Dominant Range Index indicator and how it helps me make swift and data-driven trade and investment decisions.
Firstly, when you buy or sell shares of stocks, how do you identify the price where your trade is most likely executed?
It’s important to identify that.
You don’t want to waste the whole trading day lining up your order only to see it unexecuted by the end of each trading day.
Over the past eight years that I’ve been guiding local and foreign traders and investors in the Philippine Stock Exchange, I regularly hear these sentiments:
“I wanted to sell at the highest possible price. Unfortunately, no one wants to buy my shares of stocks at my ambitiously priced selling price.”
“I wanted to buy at the lowest possible price. Pfft. Nobody wants to sell their shares of stocks at the ridiculously cheap price I want.”
Does that sound familiar to you?
It all revolves around the principle of supply and demand.
Who doesn’t want to be able to sell at the highest possible price?
Who doesn’t want to be able to buy at the lowest possible price?
I want that. You want that. Everyone wants that.
But if the foot of that desire doesn’t stand on data, you’re just relying on sheer luck.
My goodness, gracious. That’s a setup for a more painful than profitable experience trading the market.
Sell at the highest possible price.
Okay!
Buy at the lowest possible price.
Okay!
But make sure you place that trade within the price range that got the BIGGEST VOLUME and HIGHEST NUMBER OF TRADES.
I repeat: Biggest volume. Highest number of trades.
One of the principles that we, computer scientists, consider when calculating probabilities is the Nash Equilibrium.
Hey, you don’t need to get an extra tissue or hanky. I won’t make your nose bleed.
In layman’s terms, you need to consider the decisions of other traders and investors if you want to have an optimal trade and investment decision.
How do I do that in the stock market?
I identify the price points or range with the biggest volume and highest number of trades.
The range with the biggest volume and highest number of trades is what I call DOMINANT RANGE.
If the dominant range is closer to the INTRADAY HIGH than the INTRADAY LOW, it supports the theory that the uptrend is likely to continue.
If the dominant range is closer to the INTRADAY LOW than the INTRADAY HIGH, the downtrend will likely continue.
If you buy or sell stock shares, you want to see first where the dominant range is so that your transaction will have a big chance of getting executed.
If you are buying shares of stocks at the intraday low, but the dominant range is closer to the intraday high than the intraday low, you get a slim chance of a successful trade. You’re a low-baller dreaming of buying shares at a price significantly lower than what sellers are willing to sell.
Did you now get the principle?
I’m not going to elaborate further here because I’ve already written nearly 600 words at this point. Not many people love to read novels.
If you want to learn more from me, subscribe to my stock market consultancy service.
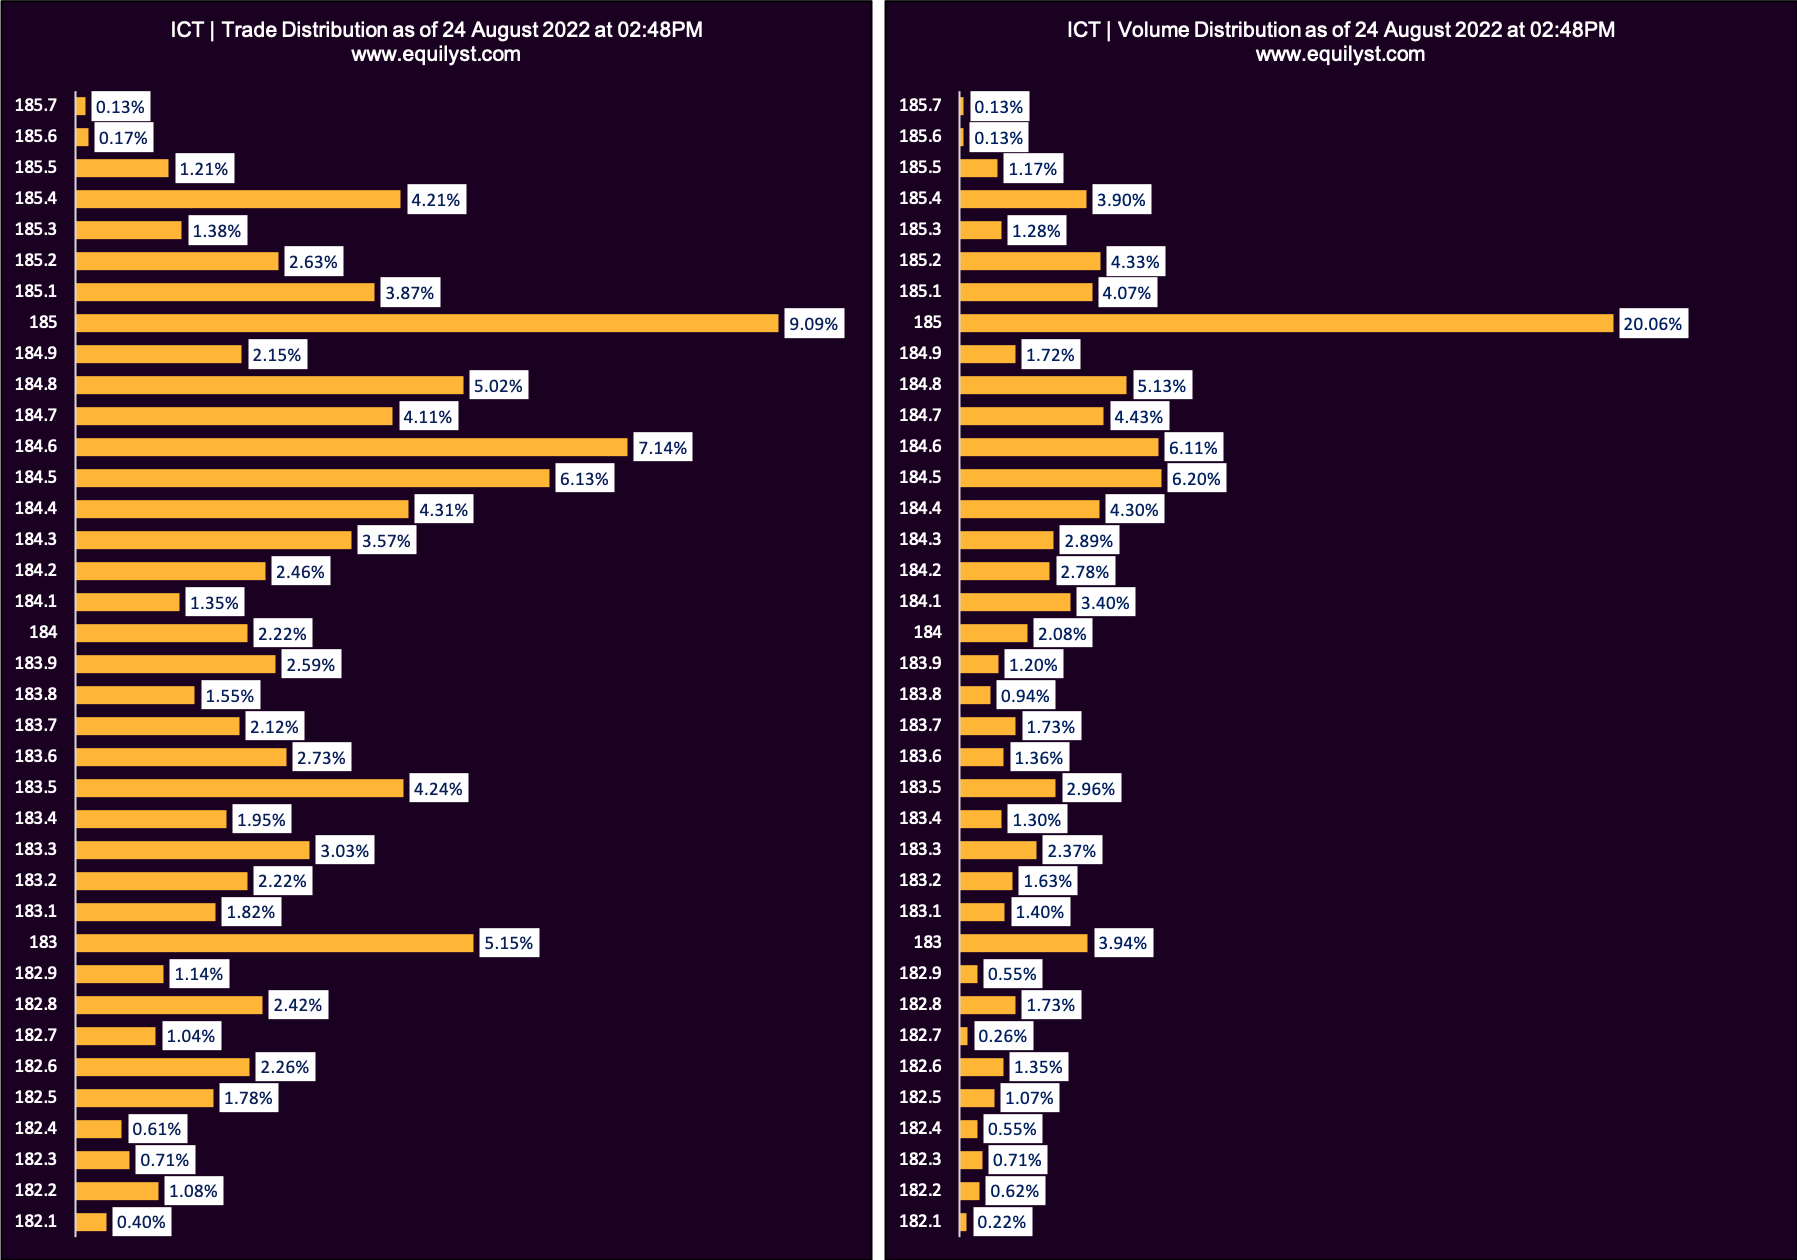
Now, I’m going to share with you the Dominant Range Index rating of these 10 Top Traded stocks that got the highest number of trades as of 2:46PM on August 24, 2022.
Int’l Container Terminal Services (ICT)
Dominant Range Index: BULLISH
Last Price: 184.9
VWAP: 184.36
Dominant Range: 185 – 185
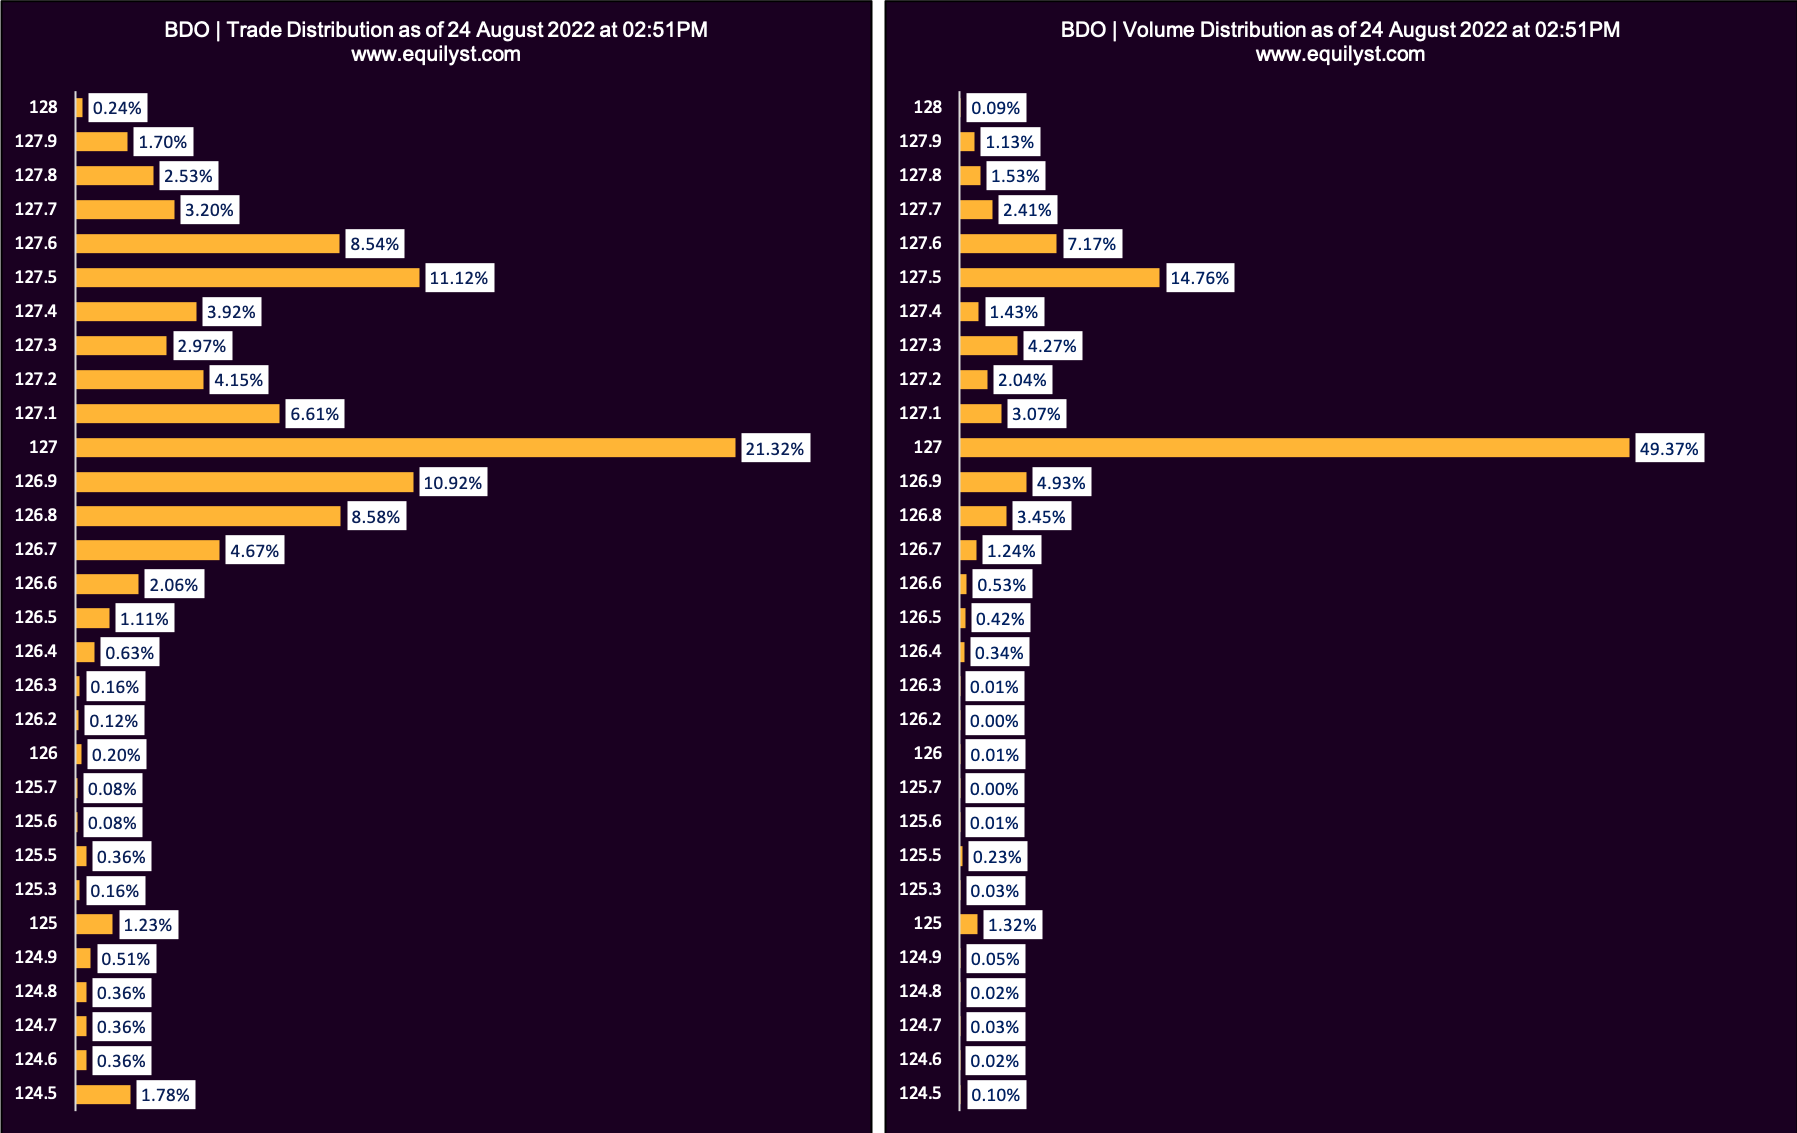
 BDO Unibank (BDO)
Dominant Range Index: BULLISH
Last Price: 127
VWAP: 127.12
Dominant Range: 127 – 127
 Aboitiz Equity Ventures (AEV)
Dominant Range Index: BULLISH
Last Price: 56.5
VWAP: 56.33
Dominant Range: 56.05 – 56.45
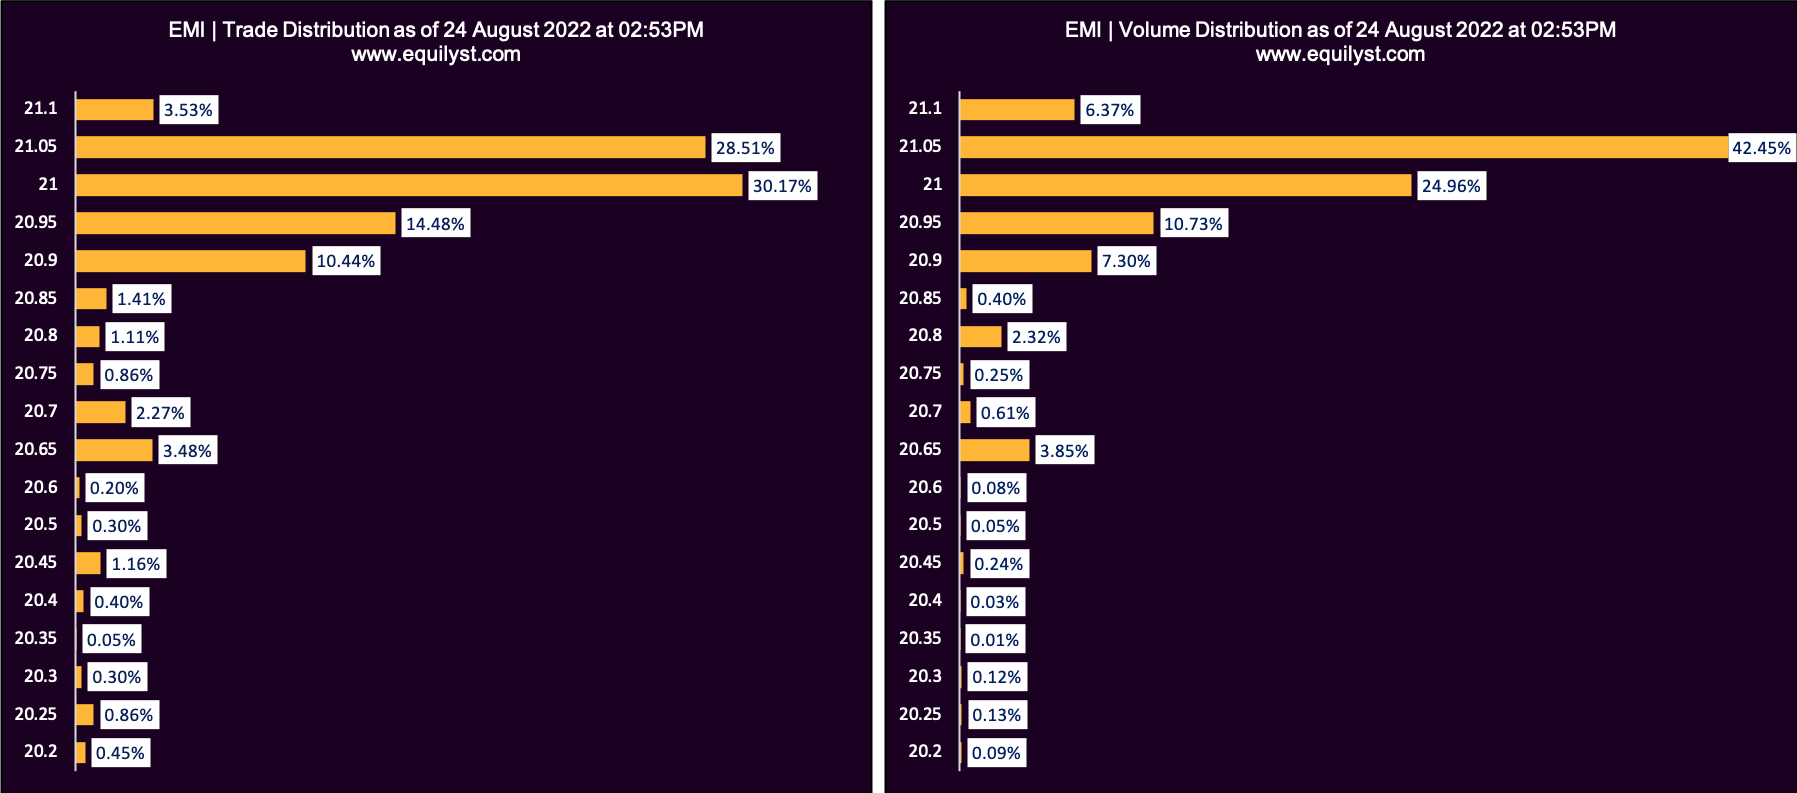
 Emperador (EMI)
Dominant Range Index: BULLISH
Last Price: 20.65
VWAP: 20.99
Dominant Range: 21 – 21.05
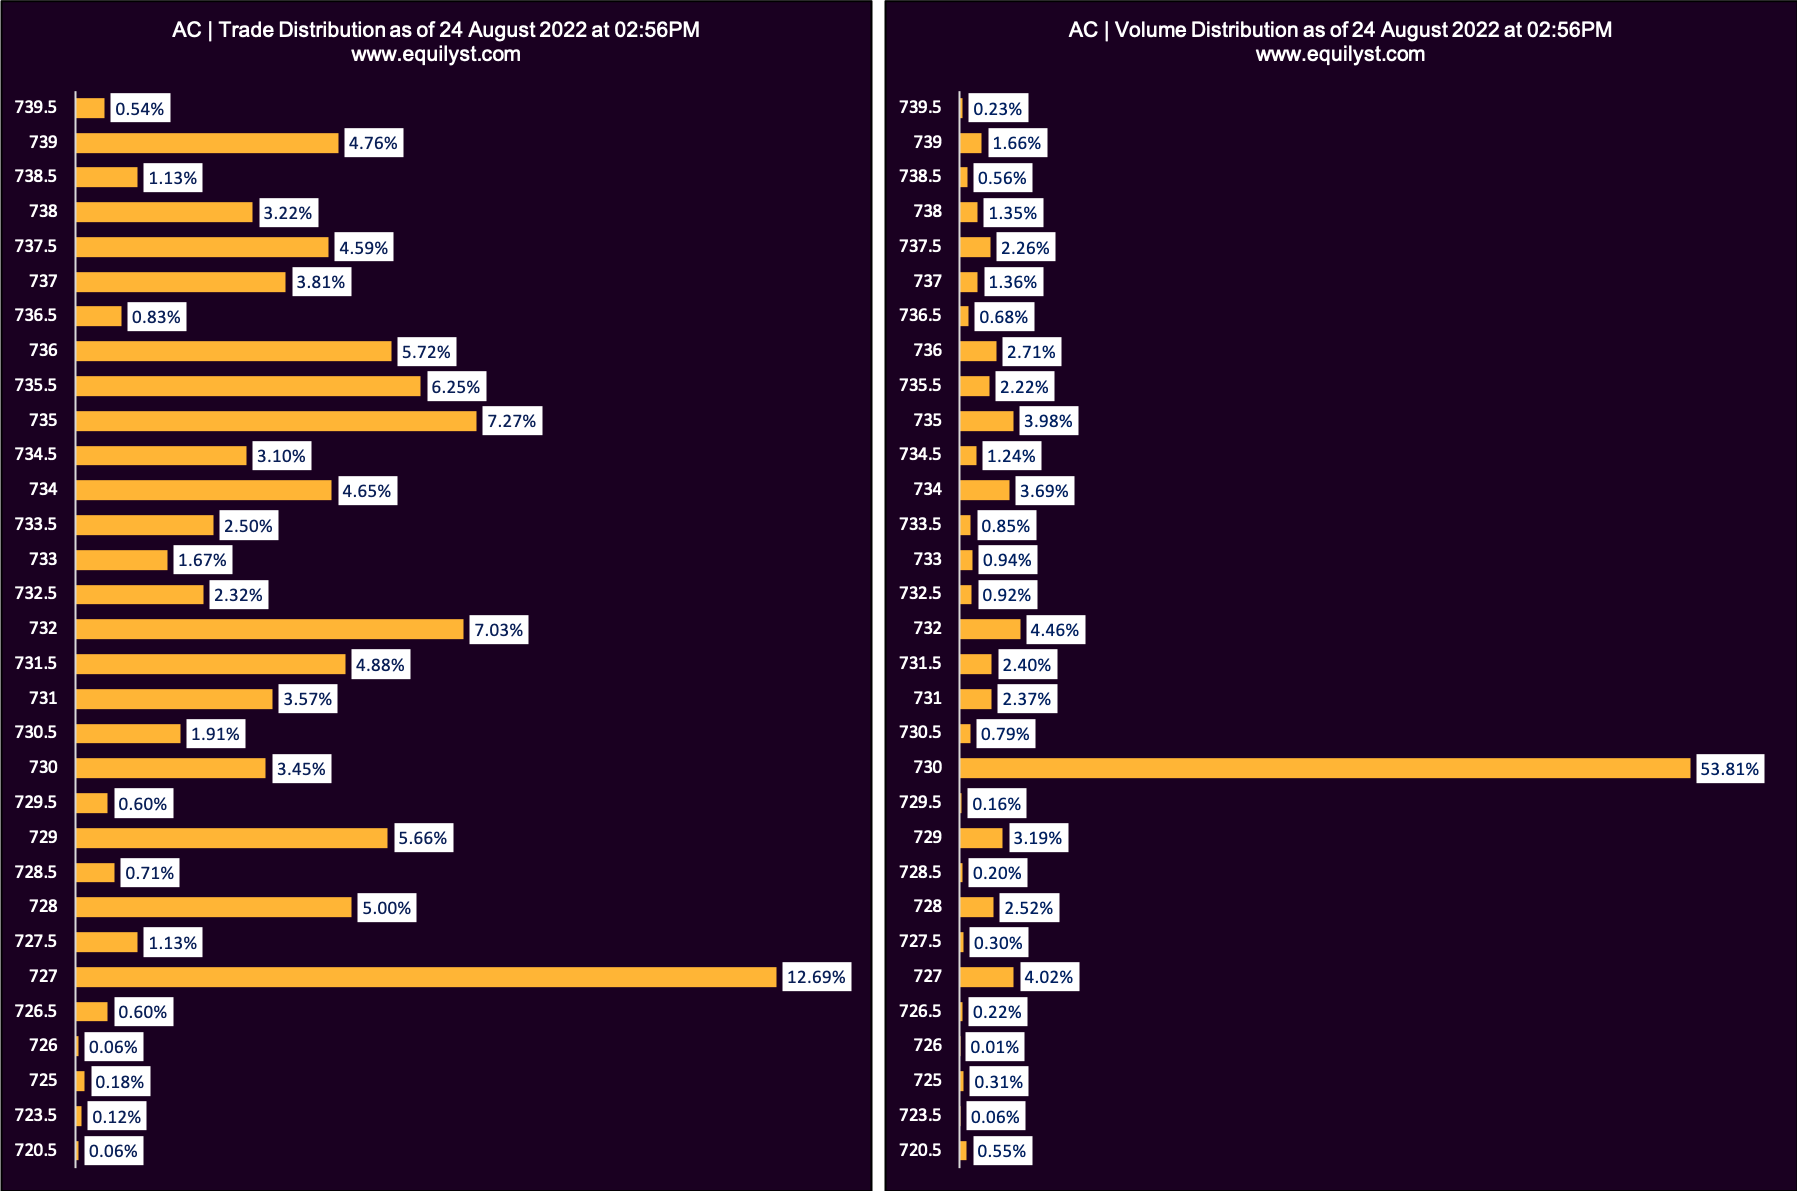
 Ayala Corporation (AC)
Dominant Range Index: BEARISH
Last Price: 730
VWAP: 731.26
Dominant Range: 727 – 730
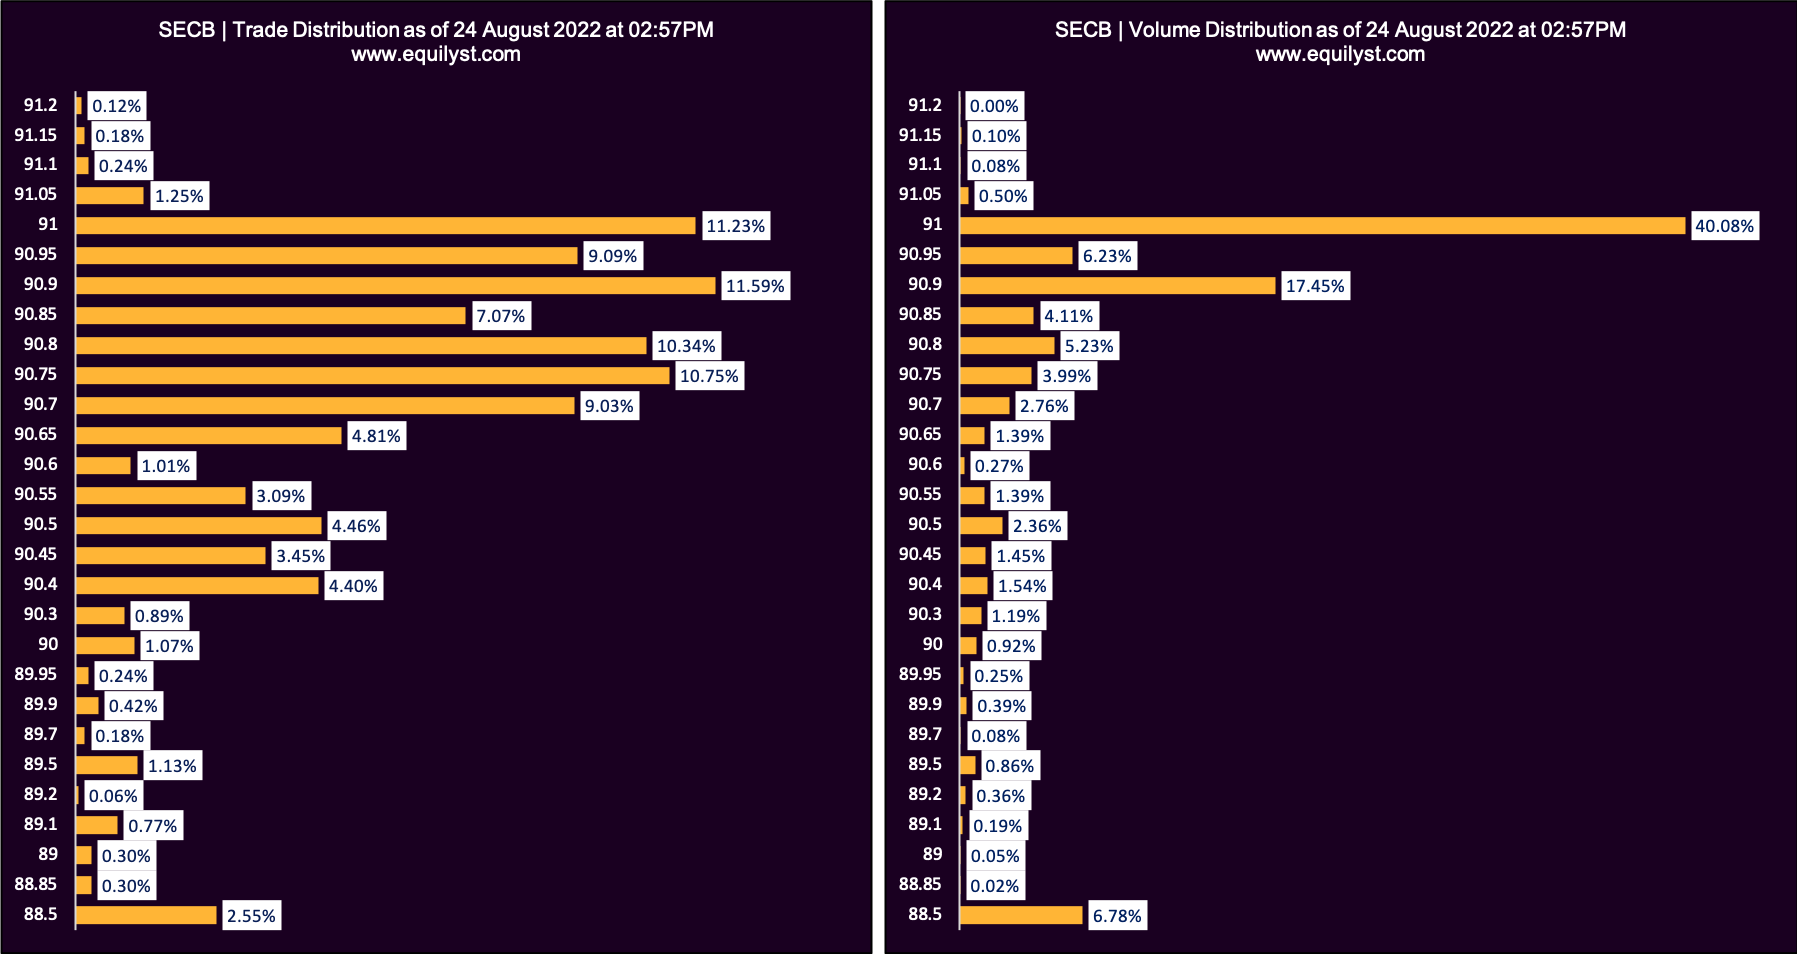
 Security Bank Corporation (SECB)
Dominant Range Index: BULLISH
Last Price: 91
VWAP: 90.68
Dominant Range: 90.9 – 91
 Converge ICT Solutions (CNVRG)
Dominant Range Index: BEARISH
Last Price: 18.7
VWAP: 18.72
Dominant Range: 18.7 – 18.7
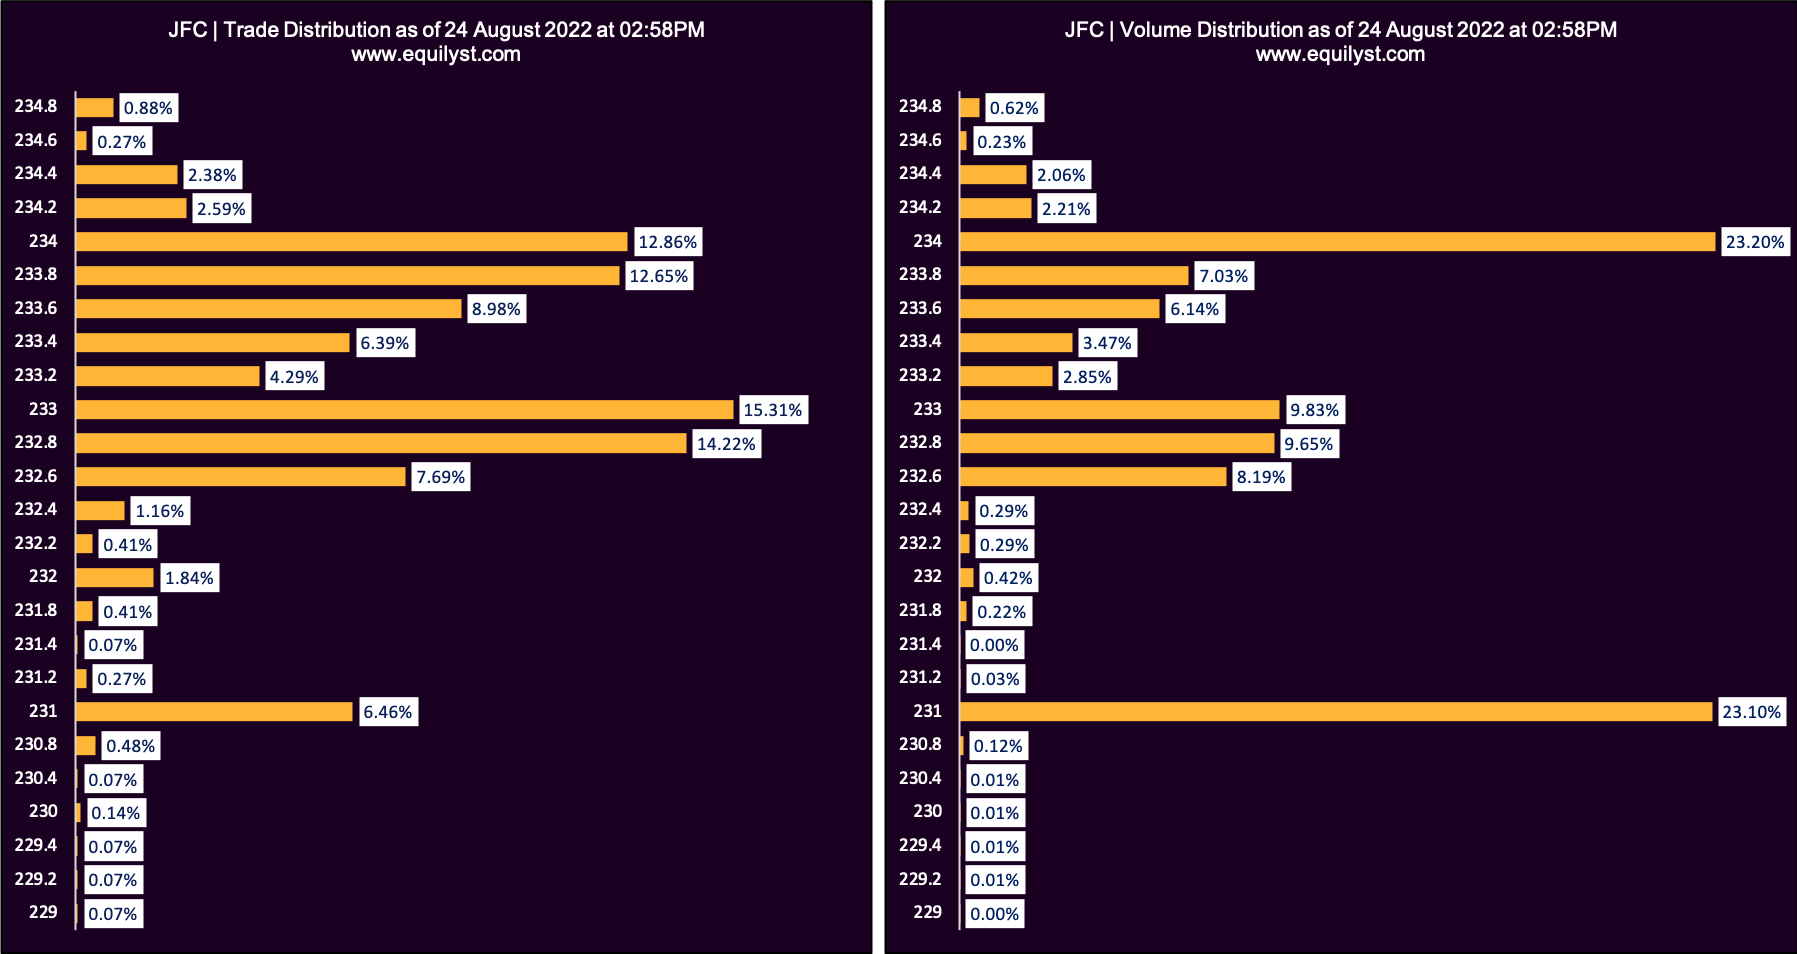
 Jollibee Foods Corporation (JFC)
Dominant Range Index: BULLISH
Last Price: 231
VWAP: 232.89
Dominant Range: 233 – 234
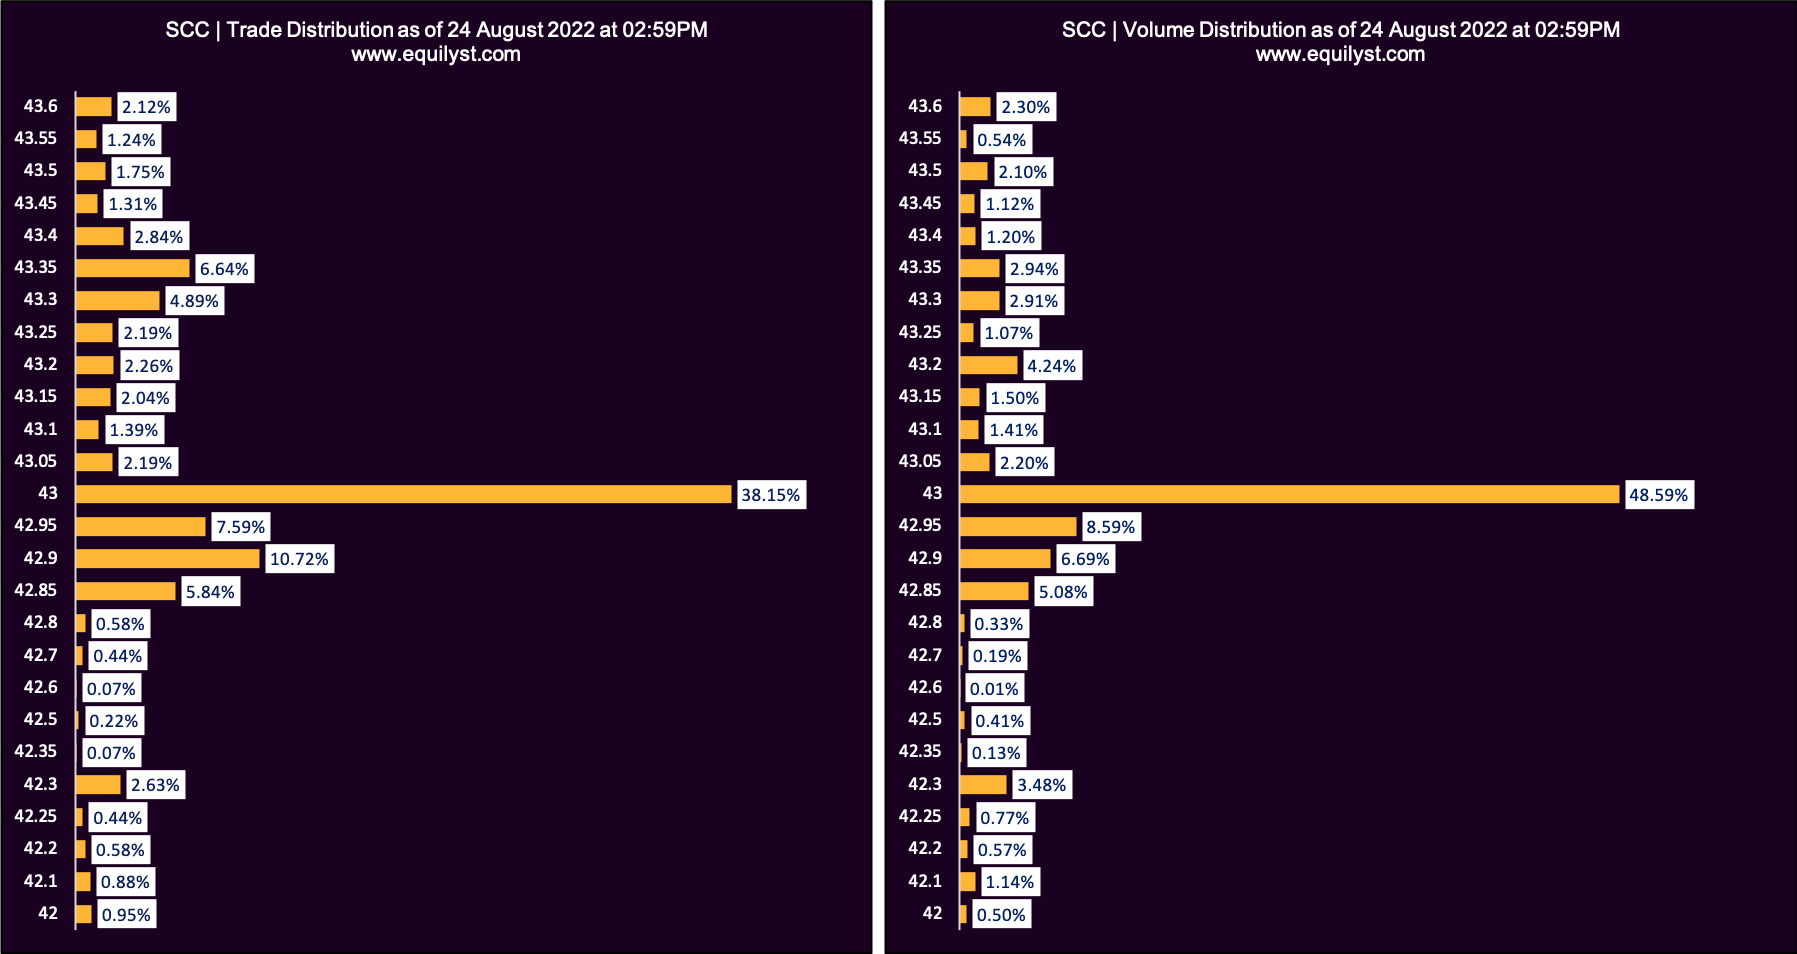
 Semirara Mining and Power Corporation (SCC)
Dominant Range Index: BULLISH
Last Price: 43
VWAP: 43.0
Dominant Range: 43 – 43
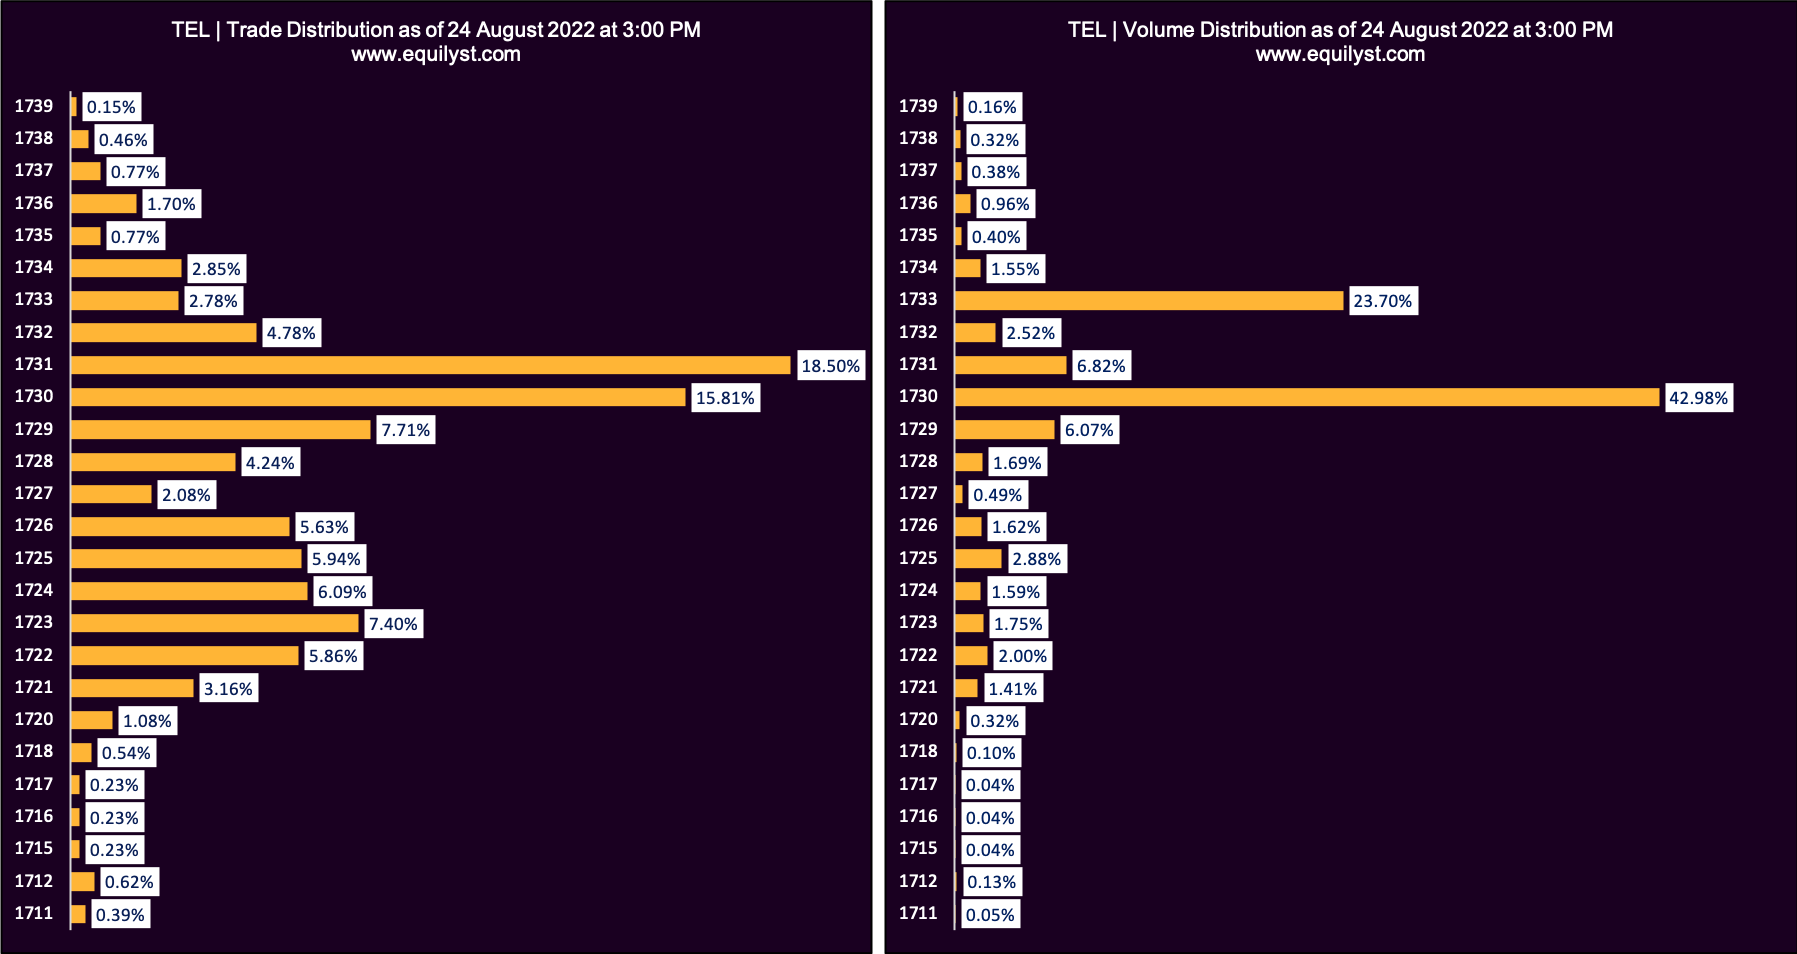
 PLDT (TEL)
Dominant Range Index: BULLISH
Last Price: 1730
VWAP: 1,730.12
Dominant Range: 1730 – 1731
 Final Reminder
The dominant range is subject to change.
The dominant range for each stock is only as of the time stipulated on each chart. Check the time stamp on each chart.
All of my clients may ask for the dominant range of any PSE-listed stock in our Private Clients Forum. You’ll get a response within a few seconds.
If you want to learn more from me, subscribe to my stock market consultancy service.
I have my signature approach in doing technical analysis. I’m not your regular technical analyst.
- MA, BDO, ALI, URC, PX: Is Their Dominant Range Pointing to a Breakout? - March 14, 2025
- Tracking Market Sentiment: MTD Ratings for 30 Bluechip Stocks (March 2025) - March 13, 2025
- PSEi Stalls Below 6,260 as Market Awaits Political Shift - March 12, 2025


