What’s In It for You If Know the Dominant Price Range of Stocks?
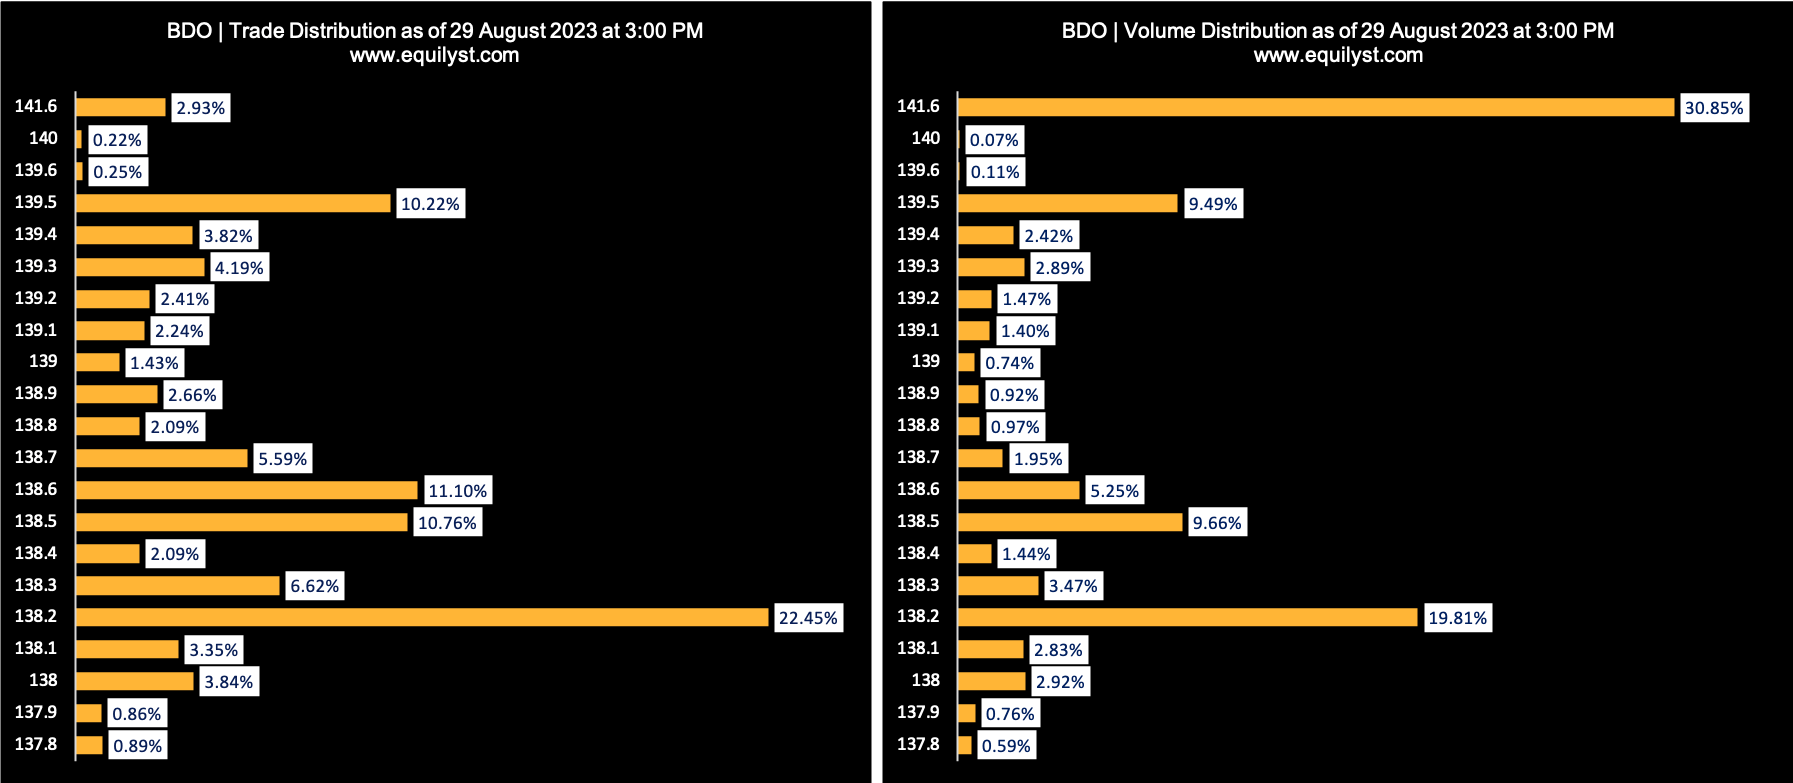
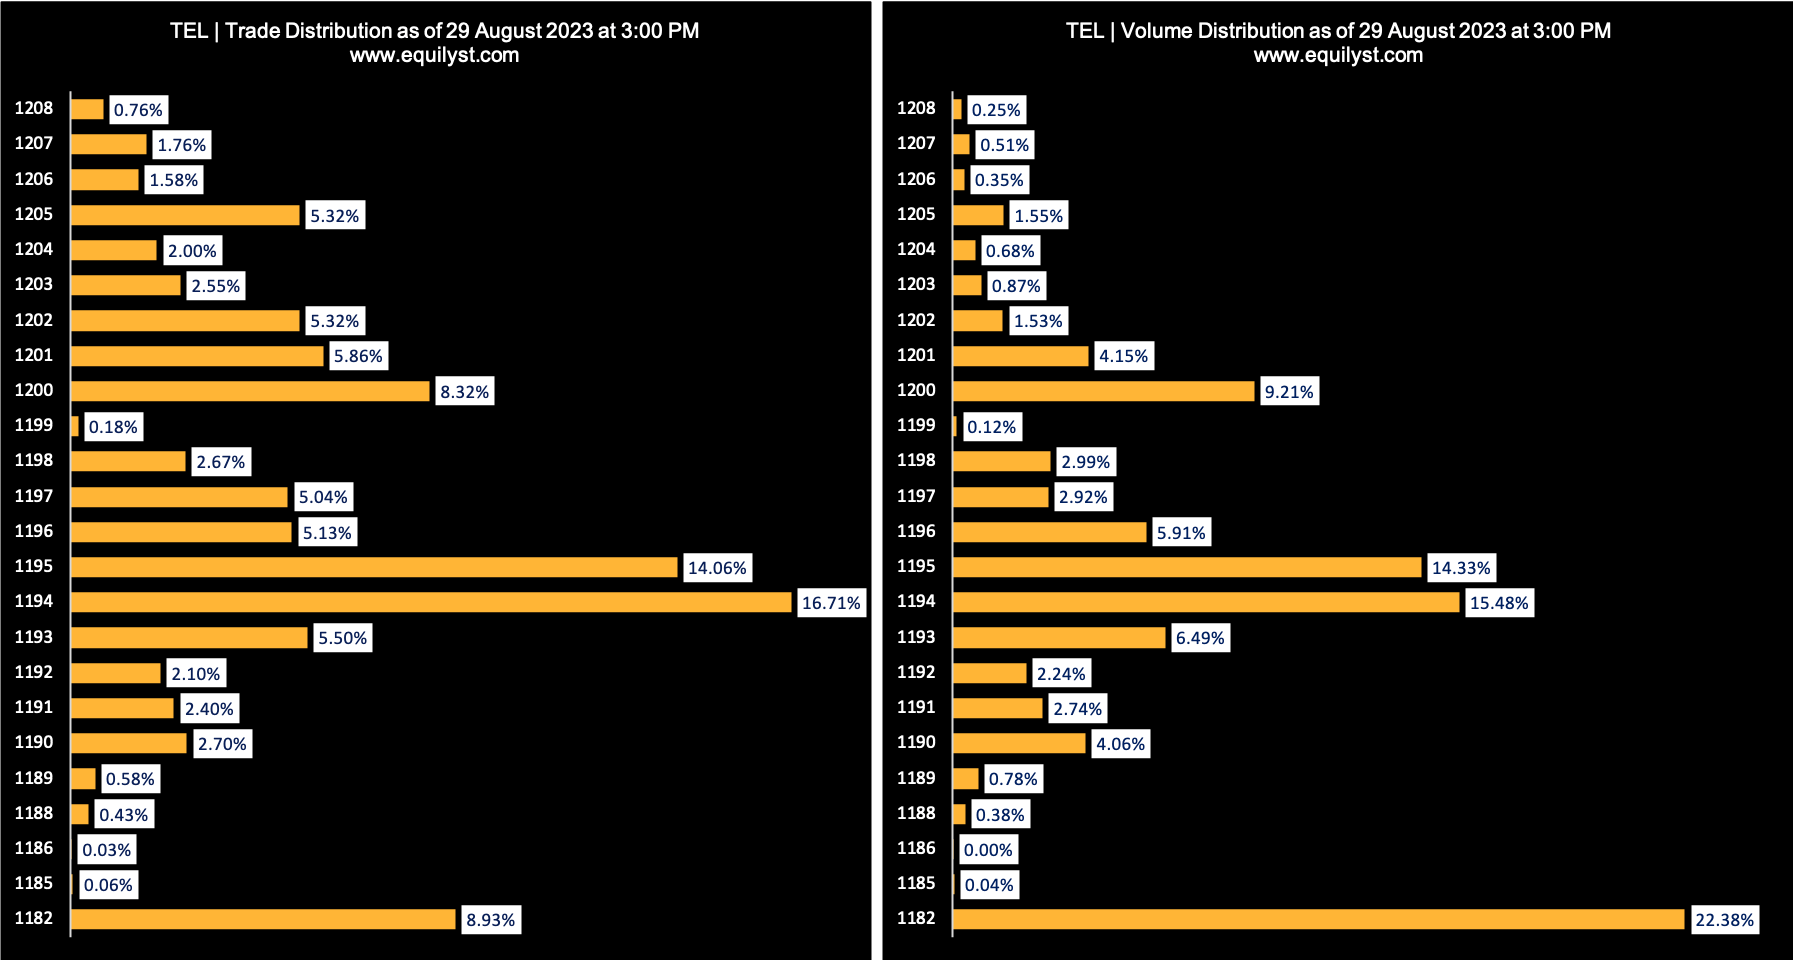
The dominant price range is either a standalone price or a range of prices with the highest volume and the greatest number of trades.
Let me respond to that question with more questions.
Imagine you’re on the verge of buying the stock. If the dominant price range is closer to the intraday low than the intraday high, will you rush into buying, or will you wait a bit longer because the price is likely to continue moving downward?
Now, consider you’re about to realize your gains, even though your trailing stop is still in place. If the dominant price range is closer to the intraday high than the intraday low, will you rush into selling, or will you wait a bit longer because the price is likely to continue moving upward?
Picture this: it’s been 60 minutes since the opening bell. If the current price is at the intraday high itself, but the dominant price range includes the intraday low, wouldn’t that make you question the sustainability of the intraday bullishness?
I’ve only presented you with three scenarios where understanding the location of the dominant price range is useful in decision-making. There’s a lot more we can discuss in my stock investment consultancy service. Learn about the requirements here.
Most Viewed Disclosures on PSE Edge
There are many ways to know which stocks investors are checking. One of those ways is by means of checking the Most Viewed Disclosures section on PSE Edge’s website.
In this report, I’d like to share the price points with the biggest volume and highest trades for the five most viewed disclosures as of August 29, 2023.
- Acen Corporation (ACEN)
- PLDT (TEL)
- DoubleDragon Corporation (DD)
- Philippine National Bank (PNB)
- BDO Unibank (BDO)
My Stock Selection Process When Writing
I also would like to take this opportunity to inform you that whenever I write an article about a specific stock or a group of stocks, I always have a data-driven basis for picking those stocks. I don’t write about a specific topic just because it’s in my portfolio or watchlist.
When I write a stock analysis, the stock either appeared in the Top Gainers, Most Active, Worst Loser, Top Traded, or Most Viewed Disclosures list. Sometimes, I ask members of stock market-related Facebook Groups to vote for the stock that they’d like me to write about.
Why do I write that way? Why don’t I just write about any stock of my own choosing?
It is to avoid the misconception that I am hyping or bashing a stock. This is why I have established a stock selection method for article writing that is out of my control and influence.
Also, when I write, I present both bearish and bullish sentiments relative to what I see on the charts and data.
At the end of it, you, my readers, will have to exercise your ability to rationalize and make a data-driven decision relative to your risk tolerance and personal financial circumstances.
I fervently hope that I have no monkey audience but rational beings.
Is the Dominant Price Range an Absolute Forecaster of Tomorrow’s Trend?
When it comes to all types of analysis, we’re not attempting to predict exact or certain future outcomes, as that is not achievable unless we discover how to travel to the future and return precisely to the moment we departed from.
Our approach is data-driven, as we seek to establish a foundation for probabilities.
If the data-driven analysis is proven wrong by the market, there’s a methodology you can revert to and optimize.
However, if the market demonstrates that your gut feeling or hunch is incorrect, what can you optimize? The way you experience a gut feeling? Does that even make logical sense?
I incorporated the theory of Nash Equilibrium into the development of my proprietary Dominant Price Range Index indicator.
My fellow computer and data scientists are familiar with this theory. For those of you who are not acquainted with Nash Equilibrium, I’ll leave that as your assignment, so you can remember that you still possess the ability and energy to search on Google or YouTube. You lose what you don’t use.
Dominant Price Range of BDO, TEL, DD, PNB, and BDO
Acen Corporation (ACEN)
Dominant Range Index: BULLISH
Last Price: 5.14
VWAP: 5.12
Dominant Range: 5.10 – 5.14
PLDT (TEL)
Dominant Range Index: BEARISH
Last Price: 1,182.00
VWAP: 1,192.80
Dominant Range: 1,182.00 – 1,195.00
DoubleDragon Corporation (DD)
Dominant Range Index: BULLISH
Last Price: 7.72
VWAP: 7.74
Dominant Range: 7.69 – 7.70
Philippine National Bank (PNB)
Dominant Range Index: BEARISH
Last Price: 18.30
VWAP: 18.31
Dominant Range: 18.28 – 18.30
BDO Unibank (BDO)
Dominant Range Index: BULLISH
Last Price: 141.60
VWAP: 139.53
Dominant Range: 139.5 – 141.60
What Did You Learn About the Importance of Knowing the Dominant Price Range?
If you find this article helpful, I’d like you to share in the comments below how it has specifically assisted you in making intelligent investment decisions
Are you looking to hire a crypto or stock investment consultant? Complete this form to avail yourself of my crypto and stock market consulting service.
Are you looking to hire a content writer for your crypto and stock investment website? Here’s the form you need to fill out.
- Key Prices for PH Bluechip Stocks 30% Above 52-Week Low - June 4, 2024
- May 2024 Market Sentiment Rating of 30 PH Bluechip Stocks - June 3, 2024
- EquiTalks: ICT, BPI, AEV Updates – 5.29.2024 - May 29, 2024


