PSE:RLC’s Q1 Net Income: P2.66B, Surpasses Pre-Pandemic
Robinsons Land Corp. (PSE:RLC), a property developer led by Gokongwei, generated a net income of P2.66 billion in the initial quarter of 2023.
In a statement made on Tuesday, RLC disclosed that its first-quarter profit surpassed its earnings before the pandemic by 45%.
Consolidated revenues reached P9.28 billion, which is a year-on-year increase of 39%.
The growth was particularly significant in RLC’s malls and hotels divisions, which experienced a 38% surge in revenues.
That revenue is worth P6.77 billion and contributes 73% to the overall consolidated revenues.
The property development portfolio of the company also exhibited impressive performance, with revenues amounting to P2.51 billion, which marks a substantial 42% increase.
This boost can be attributed to better recognition of revenue from RLC Residences and earnings generated from equity shares in joint venture projects.
RLC is optimistic that its joint venture projects will significantly impact its bottom line in the upcoming quarters.
According to Frederick Go, the president and CEO of RLC, he said that they had achieved strong financial results in the first quarter after a remarkable year.
He attributed this success to their commitment to strategic initiatives, which were built on solid fundamentals and a strong balance sheet.
During this period, RLC allocated P4.52 billion for capital expenditures, including the development of malls, offices, hotels, and warehouse facilities, land acquisitions, and construction projects for residential properties within its local operations.
Robinsons Land Corporation Technical Analysis
PSE:RLC closed on Friday, July 14, 2023, at P14.06 per share, up by 0.57%.
However, this stock is down by 1.54% month-to-date and down by 6.02% year-to-date.
While RLC trades above its 10-day simple moving average (SMA), it’s been closing lower than its opening price since Thursday.
I see no volume-related concerns since the daily volume is almost always higher than 100% of the stock’s prevailing 10-day volume average per day since July 4, 2023.
RLC’s moving average convergence divergence (MACD) registered a golden across above the signal line last Friday, which is a bullish signal based on the classical interpretation of the MACD.
The risk level of RLC remains low according to its 10-day historical volatility score last Friday. This means no alarming engulfing candlesticks and price gaps happened within the past 10 trading days.
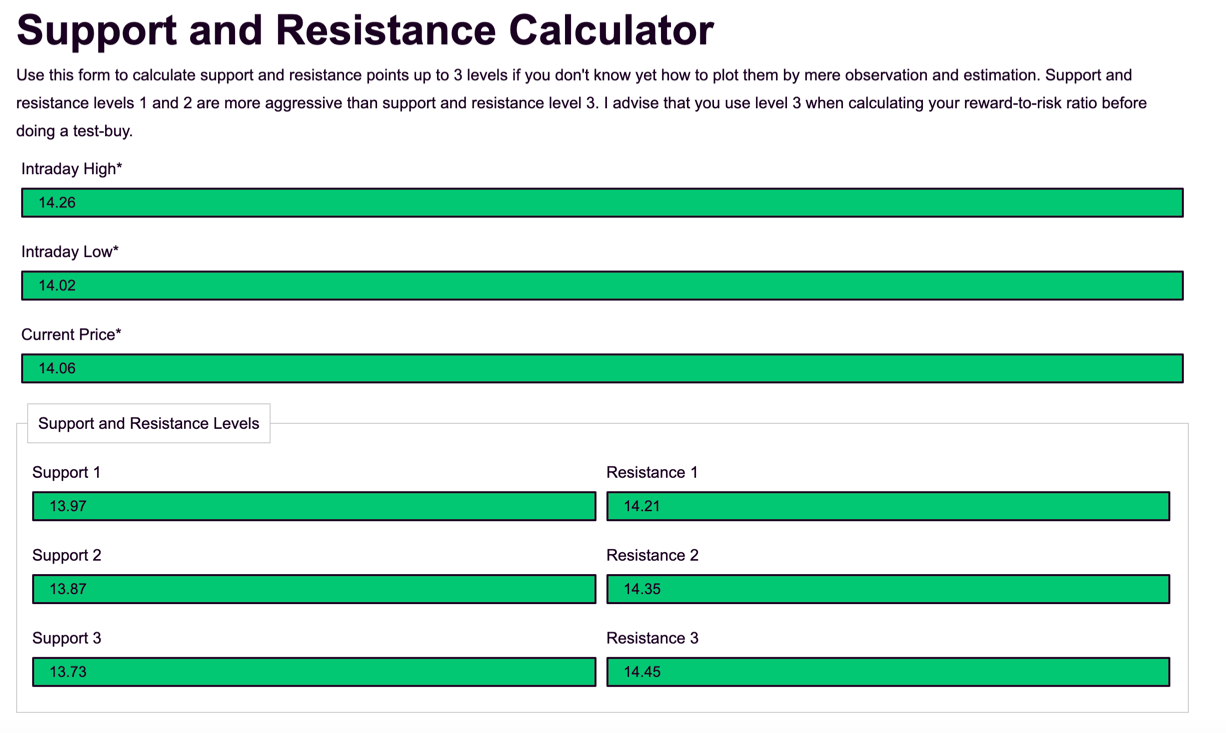
RLC’s support is near P13.40 while the resistance is near P15.00.
If you don’t know yet how to identify the stock’s support and resistance levels using horizontal lines, Fibonacci retracements/extensions, moving averages, and other oscillators, you may use my Support and Resistance Calculator here.
Trade-Volume Distribution Analysis
RLC’s dominant range last Friday is closer to its intraday low than the intraday high.
Only one 6-digit volume transacted in one trade last Friday (166,900 shares) at P14.06 apiece between Regis Partners and AP Securities at exactly 2:50 PM.
Seeing the volume-weighted average price lower than the closing price reduces the conviction to buy more RLC shares.
Dominant Range Index: BEARISH
Last Price: 14.06
VWAP: 14.13
Dominant Range: 14.06 – 14.14
Market Sentiment Analysis
I am presenting to you my market sentiment analysis using the EOD and MTD data.
If your trailing stop is still intact, the bullish MTD market sentiment analysis gives you the data-driven confidence to hold your position.
However, as I teach during one-on-one consultations with our TITANIUM clients, you may consider pre-empting your trailing stop or recalculating your trailing stop with a reduced risk percentage when the stock’s Dominant Range Index and Market Sentiment Index aren’t bullish for 2 to 3 consecutive trading days.
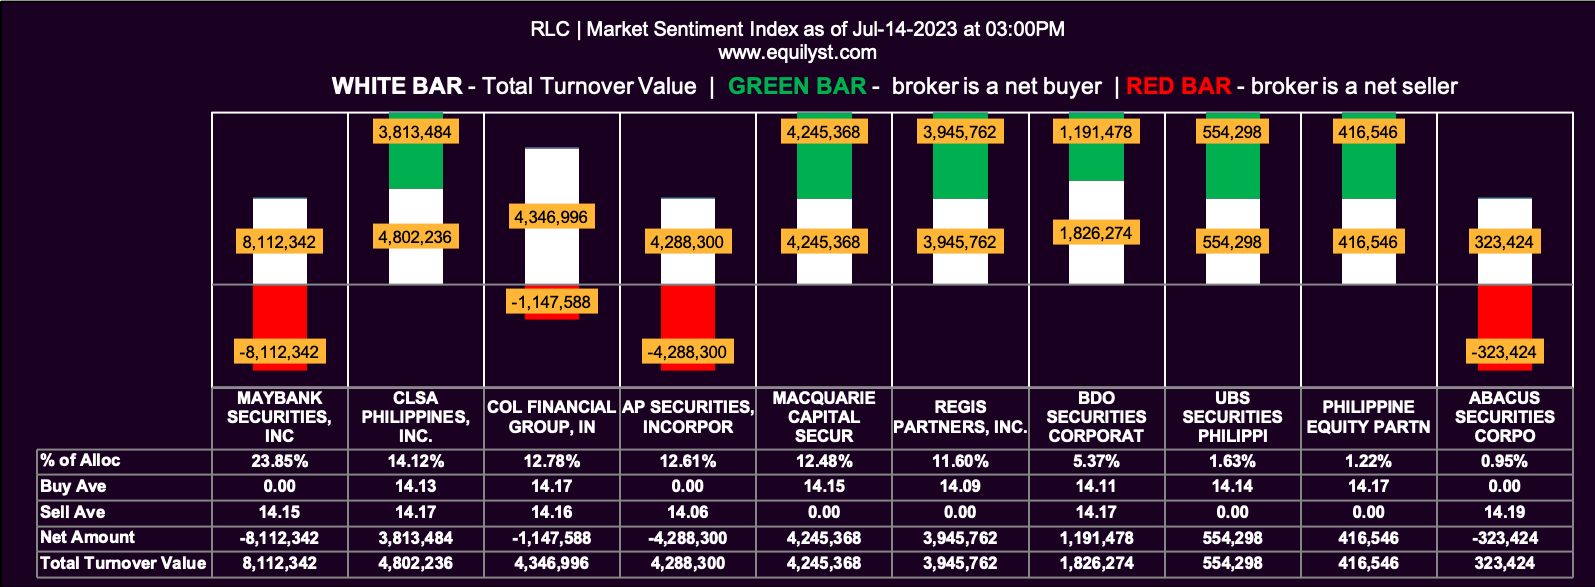
Market Sentiment (EOD): July 3, 2023
Market Sentiment Index: BEARISH
10 of the 21 participating brokers, or 47.62% of all participants, registered a positive Net Amount
8 of the 21 participating brokers, or 38.10% of all participants, registered a higher Buying Average than Selling Average
21 Participating Brokers’ Buying Average: ₱14.14347
21 Participating Brokers’ Selling Average: ₱14.15058
6 out of 21 participants, or 28.57% of all participants, registered a 100% BUYING activity
7 out of 21 participants, or 33.33% of all participants, registered a 100% SELLING activity
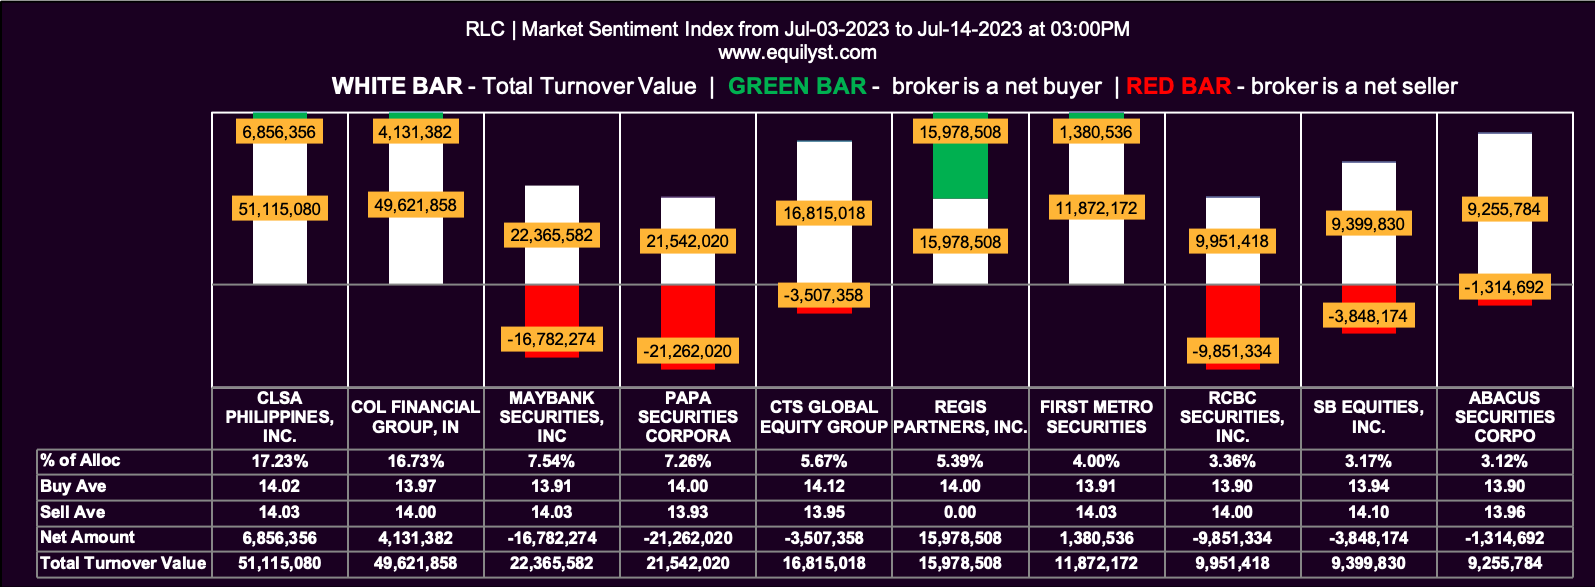
Market Sentiment (MTD): July 3, 2023 to July 14, 2023
Market Sentiment Index: BULLISH
41 of the 60 participating brokers, or 68.33% of all participants, registered a positive Net Amount
32 of the 60 participating brokers, or 53.33% of all participants, registered a higher Buying Average than Selling Average
60 Participating Brokers’ Buying Average: ₱13.96353
60 Participating Brokers’ Selling Average: ₱14.01052
18 out of 60 participants, or 30.00% of all participants, registered a 100% BUYING activity
5 out of 60 participants, or 8.33% of all participants, registered a 100% SELLING activity
Need Help on How to Decide Based on your Risk Tolerance?
Optimize your stock portfolio for maximum returns with our Stock Portfolio Rehabilitation Program.
Become a TITANIUM client to gain knowledge on capital preservation, protecting gains, and minimizing losses while trading and investing in the Philippine stock market.
Become a PLATINUM client to receive comprehensive technical analysis and personalized recommendations based on your entry price, average cost, investment goals, and risk tolerance.
Become a GOLD client to engage in teleconsultations with our team while trading occurs, providing real-time guidance over the phone.
- MA, BDO, ALI, URC, PX: Is Their Dominant Range Pointing to a Breakout? - March 14, 2025
- Tracking Market Sentiment: MTD Ratings for 30 Bluechip Stocks (March 2025) - March 13, 2025
- PSEi Stalls Below 6,260 as Market Awaits Political Shift - March 12, 2025


