What Is a Real Estate Investment Trust (REIT)?
I’d like to explain what a Real Estate Investment Trust (REIT) is—a nifty investment vehicle that gives you the chance to hop on the real estate train without dealing with the nitty-gritty of property ownership, management, or financing.
It’s like enjoying the benefits of a luxurious cruise without having to steer the ship or navigate the waters.
These REITs were born in the United States back in 1960 and have since spread their wings across the globe, finding a home in various countries.
REITs are like a buffet of real estate investments, allowing you to indulge in a wide range of income-generating properties.
Picture yourself strolling through a bustling marketplace, with options ranging from gleaming office towers and vibrant shopping malls to cozy apartment complexes and lavish resorts.
And guess what?
They even serve up some tech-savvy dishes like data centers and cell towers.
However, the main course is always focused on properties that generate steady income.
To qualify as a REIT, a company needs to satisfy specific requirements set by tax authorities.
In the United States, for example, they have to dish out at least 90% of their taxable income to shareholders in the form of dividends.
Think of it as a generous host at a party who shares 90% of the delicious snacks with the guests, and in return, the host gets to skip the tax bill.
But remember, as a shareholder, you’ll have to pay taxes on the dividends you receive.
Rewards on REITs
Investing in REITs serves up a variety of advantages, just like a well-curated menu.
First off, it’s like adding diverse ingredients to your investment recipe, spicing up your portfolio with real estate flavors, without requiring a hefty capital investment or the hassle of property management.
It’s akin to a chef expertly blending different ingredients to create a mouthwatering dish.
Additionally, REITs are like stocks on the market shelf, traded on major stock exchanges.
This means you can easily buy and sell them, enjoying liquidity and convenience compared to the complexities of owning property directly.
It’s like grabbing a ready-made meal from the grocery store instead of spending hours in the kitchen.
Moreover, REITs offer a delicious dessert of consistent income through regular dividend payments. It’s like having a sweet treat that satisfies your craving for stable income.
Risk on REITs
But, as with any investment, there are risks involved.
Imagine walking on a path sprinkled with stones.
Sometimes, those stones may shift, causing fluctuations in real estate prices.
Other times, the path may incline or decline due to changes in interest rates or market conditions.
So, it’s important to tread carefully, conduct thorough research, and assess your financial goals and risk appetite before diving into REITs or any other investment venture.
Before I share my trade-volume distribution and market sentiment analyses for the REIT stocks listed in the Philippine Stock Exchange, I’d like to explain the importance of these two types of analyses so you’ll appreciate their importance.
REITs Trade-Volume Distribution Analysis
To determine the best price levels for buying and selling securities, I utilize trade and volume analysis.
At Equilyst Analytics, I apply a specific method called Dominant Range analysis, which focuses on trades and volume.
During the analysis of trade and volume, I consider the position of the volume-weighted average price (VWAP) in relation to the current price.
Additionally, I evaluate how the dominant range aligns with the intraday high and low.
The dominant range signifies the price range with the highest trading volume and most trades.
By examining its proximity to the intraday high and low, I gain insights into the interest of traders and investors in driving the price higher.
To gauge participants’ optimism in buying the stock at a higher price, I analyze whether the current price surpasses the VWAP or if the VWAP falls within the dominant range, particularly closer to the intraday high.
Maintaining equilibrium between the number of trades and volume at each price level holds utmost importance. I evaluate this balance by considering the distribution of trades and volume within each group.
The outcome of this analysis leads to the development of my proprietary Dominant Range Index, which encompasses the statuses of the encoded elements.
Leveraging the processing capabilities of my algorithm, the Dominant Range Index provides a bullish or bearish rating.
As the fifth component of my 6-indicator Evergreen Strategy When Trading and Investing in the Philippine Stock Market, the Dominant Range Index incorporates the Nash Equilibrium effect, a theory that holds significant value in my profession as a computer scientist and professional stock market analyst.
Despite the potentially intricate technical nature of this explanation, I simplify it by assigning an overall bullish or bearish rating to the Dominant Range analysis.
A bullish rating indicates a probable upward price movement, while a bearish rating suggests the opposite.
REITs Market Sentiment Analysis
Market sentiment analysis is an indispensable process I need to do to make a smart investment decision.
I am the author of the proprietary technical indicator called Market Sentiment Index.
The Market Sentiment Index plays a vital role in generating a comprehensive understanding of market sentiment, enabling us to determine whether the overall sentiment leans toward a bullish or bearish bias.
It addresses the following key questions:
- How many participating brokers have recorded a positive Net Amount?
- How many participating brokers have registered a higher buying average compared to the selling average?
- What are the average buying and selling amounts across all participating brokers?
- How many participating brokers have engaged in 100% buying and selling activity?
As part of my data-driven sentiment analysis, the Market Sentiment Index acts as a neutralizer alongside other indicators within my Evergreen Strategy, which is a proprietary algorithm used for trading and investing in the Philippine stock market.
Consider a scenario where all the other indicators of my Evergreen Strategy indicate a bullish market outlook. However, if the Market Sentiment Index for a particular stock indicates a bearish sentiment, it serves as a data-driven reminder to exercise caution.
To proceed with caution, I closely monitor my trailing stop and refrain from purchasing during dips unless a confirmed buy signal is generated by my Evergreen Strategy. Additionally, I adopt a proactive approach by trimming losses or selling all shares if the Market Sentiment Index and Dominant Range Index of a stock have consecutively exhibited bearish trends for 2 to 3 days, even if my trailing stop is still intact. I refer to this proactive action as pre-empting my trailing stop, prioritizing risk management in response to prevailing market conditions.
Now that I’ve explained the two types of analyses, you’re ready to see the results of my trade and volume distribution and market sentiment analyses for these REIT stocks.
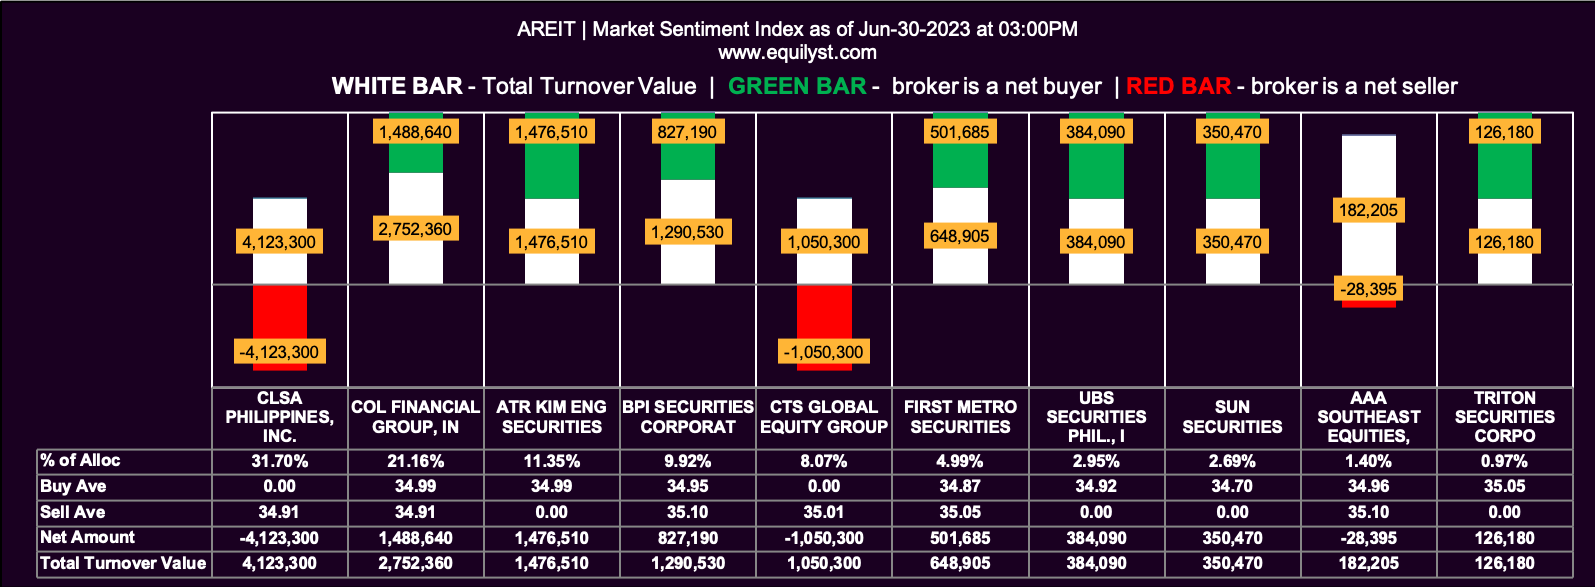
AREIT
Dominant Range Index: BEARISH
- Last Price: 34.7
- VWAP: 34.95
- Dominant Range: 34.7 – 35
Market Sentiment Index: BULLISH
- 14 of the 22 participating brokers, or 63.64% of all participants, registered a positive Net Amount
- 11 of the 22 participating brokers, or 50.00% of all participants, registered a higher Buying Average than Selling Average
- 22 Participating Brokers’ Buying Average: ₱34.93072
- 22 Participating Brokers’ Selling Average: ₱35.06603
- 10 out of 22 participants, or 45.45% of all participants, registered a 100% BUYING activity
- 6 out of 22 participants, or 27.27% of all participants, registered a 100% SELLING activity
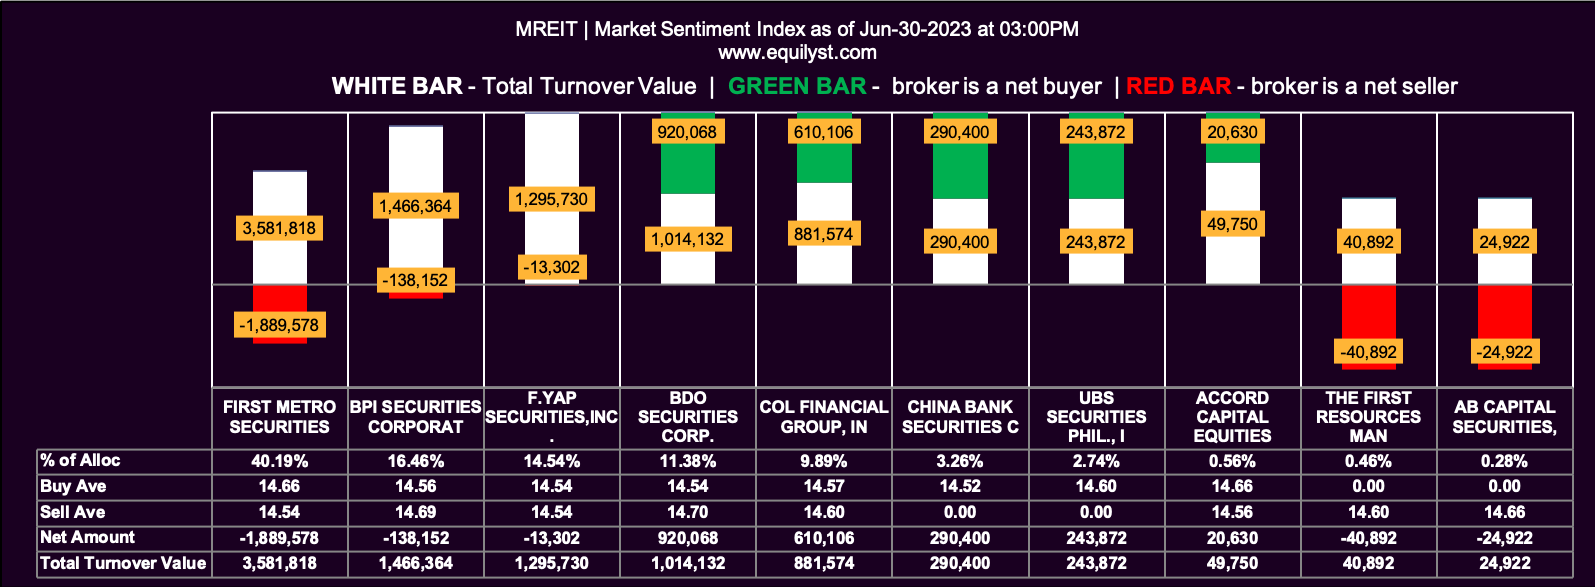
MREIT
Dominant Range Index: BEARISH
Last Price: 14.54
VWAP: 14.58
Dominant Range: 14.54 – 14.54
Market Sentiment Index: BULLISH
7 of the 12 participating brokers, or 58.33% of all participants, registered a positive Net Amount
6 of the 12 participating brokers, or 50.00% of all participants, registered a higher Buying Average than Selling Average
12 Participating Brokers’ Buying Average: ₱14.57035
12 Participating Brokers’ Selling Average: ₱14.61236
4 out of 12 participants, or 33.33% of all participants, registered a 100% BUYING activity
2 out of 12 participants, or 16.67% of all participants, registered a 100% SELLING activity
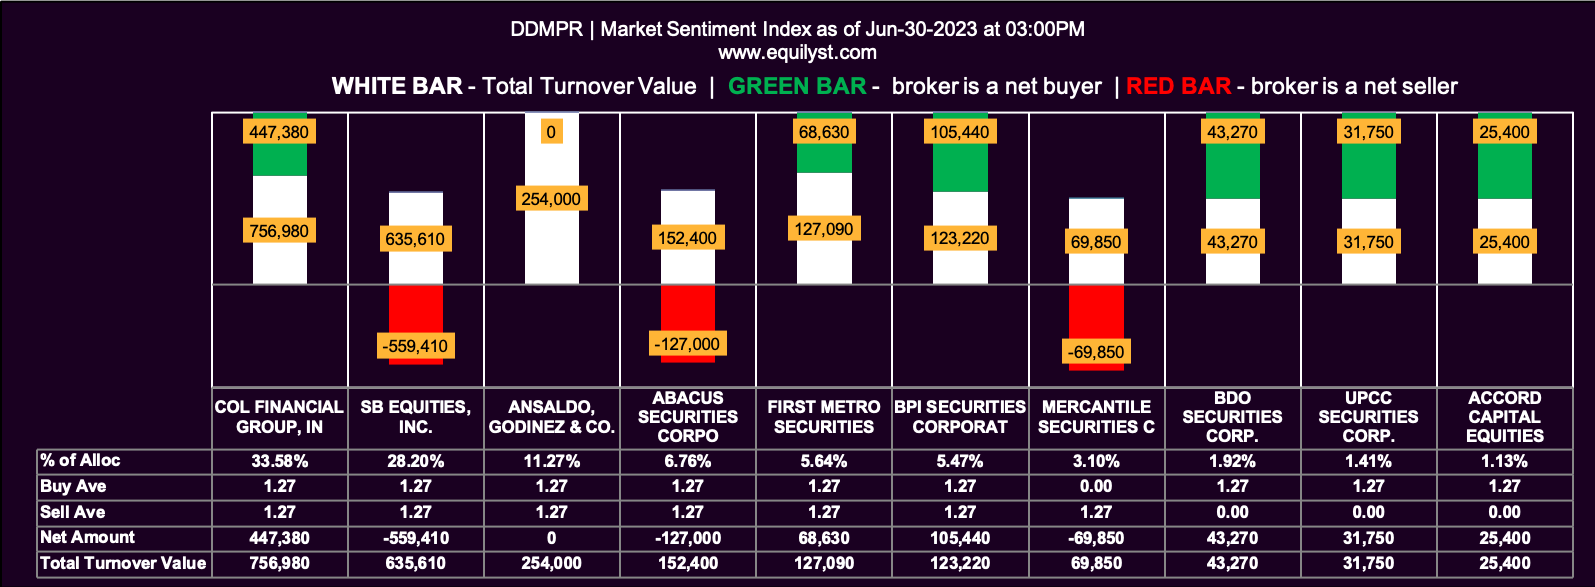
DDMPR
Dominant Range Index: BULLISH
Last Price: 1.27
VWAP: 1.27
Dominant Range: 1.27 – 1.27
Market Sentiment Index: BULLISH
8 of the 12 participating brokers, or 66.67% of all participants, registered a positive Net Amount
7 of the 12 participating brokers, or 58.33% of all participants, registered a higher Buying Average than Selling Average
12 Participating Brokers’ Buying Average: ₱1.27129
12 Participating Brokers’ Selling Average: ₱1.27016
5 out of 12 participants, or 41.67% of all participants, registered a 100% BUYING activity
1 out of 12 participants, or 8.33% of all participants, registered a 100% SELLING activity
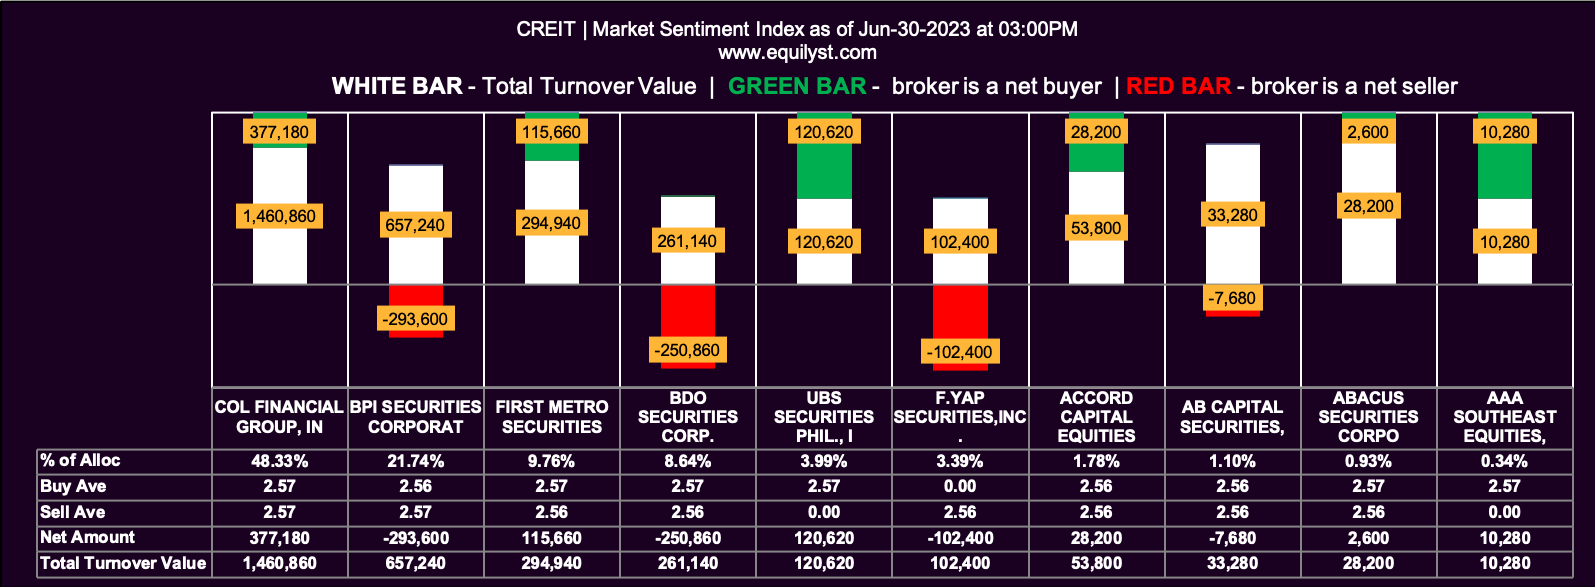
CREIT
Dominant Range Index: BULLISH
Last Price: 2.56
VWAP: 2.57
Dominant Range: 2.57 – 2.57
 Market Sentiment Index: BULLISH
6 of the 10 participating brokers, or 60.00% of all participants, registered a positive Net Amount
6 of the 10 participating brokers, or 60.00% of all participants, registered a higher Buying Average than Selling Average
10 Participating Brokers’ Buying Average: ₱2.56553
10 Participating Brokers’ Selling Average: ₱2.56236
2 out of 10 participants, or 20.00% of all participants, registered a 100% BUYING activity
1 out of 10 participants, or 10.00% of all participants, registered a 100% SELLING activity
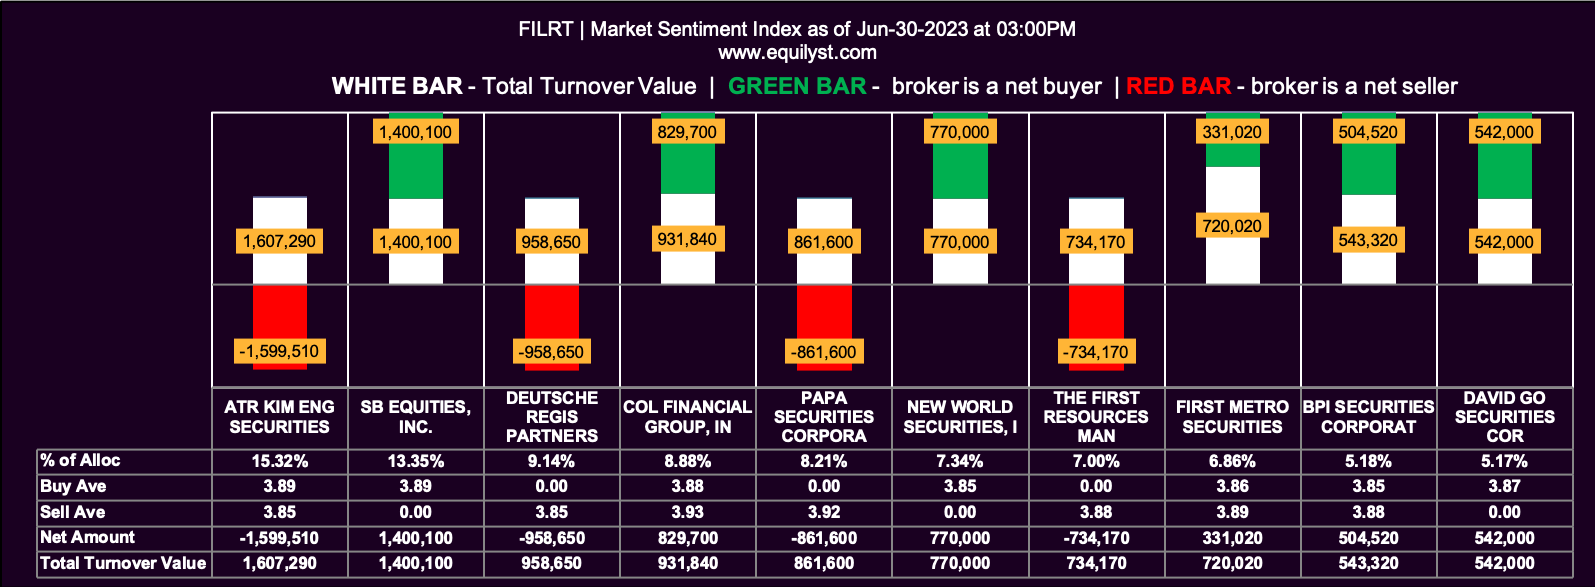
FILRT
Dominant Range Index: BULLISH
Last Price: 3.85
VWAP: 3.87
Dominant Range: 3.85 – 3.89
Market Sentiment Index: BEARISH
12 of the 21 participating brokers, or 57.14% of all participants, registered a positive Net Amount
9 of the 21 participating brokers, or 42.86% of all participants, registered a higher Buying Average than Selling Average
21 Participating Brokers’ Buying Average: ₱3.86998
21 Participating Brokers’ Selling Average: ₱3.87166
7 out of 21 participants, or 33.33% of all participants, registered a 100% BUYING activity
7 out of 21 participants, or 33.33% of all participants, registered a 100% SELLING activity
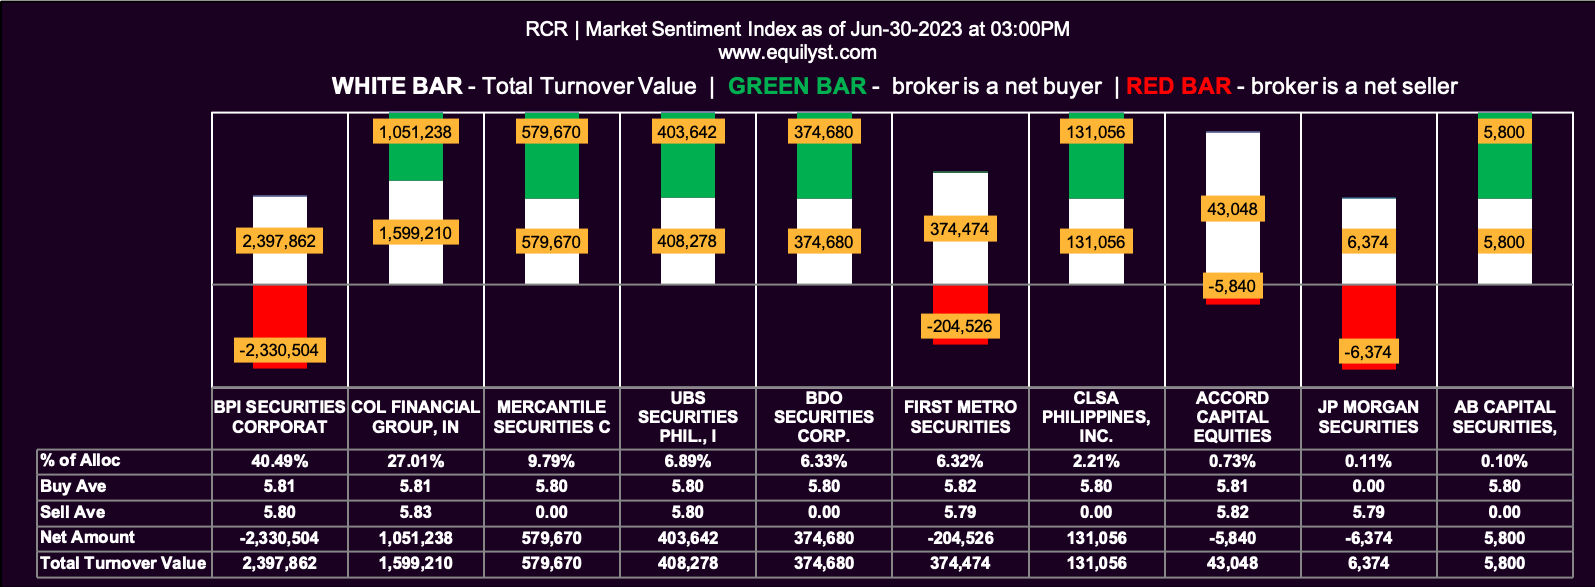
RCR
Dominant Range Index: BEARISH
Last Price: 5.8
VWAP: 5.80
Dominant Range: 5.8 – 5.8
Market Sentiment Index: BULLISH
7 of the 11 participating brokers, or 63.64% of all participants, registered a positive Net Amount
8 of the 11 participating brokers, or 72.73% of all participants, registered a higher Buying Average than Selling Average
11 Participating Brokers’ Buying Average: ₱5.80353
11 Participating Brokers’ Selling Average: ₱5.80535
5 out of 11 participants, or 45.45% of all participants, registered a 100% BUYING activity
1 out of 11 participants, or 9.09% of all participants, registered a 100% SELLING activity
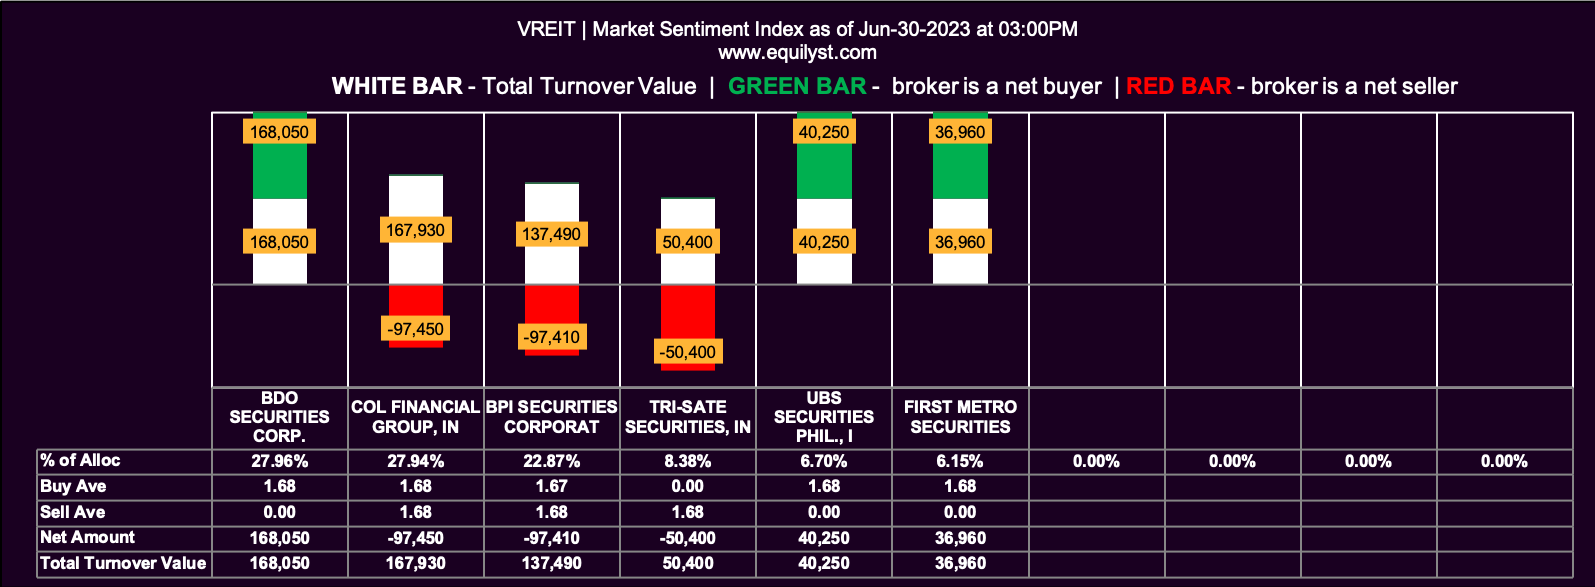
VREIT
Dominant Range Index: BULLISH
Last Price: 1.68
VWAP: 1.68
Dominant Range: 1.68 – 1.68
Market Sentiment Index: BULLISH
3 of the 6 participating brokers, or 50.00% of all participants, registered a positive Net Amount
3 of the 6 participating brokers, or 50.00% of all participants, registered a higher Buying Average than Selling Average
6 Participating Brokers’ Buying Average: ₱1.67714
6 Participating Brokers’ Selling Average: ₱1.67917
3 out of 6 participants, or 50.00% of all participants, registered a 100% BUYING activity
1 out of 6 participants, or 16.67% of all participants, registered a 100% SELLING activity
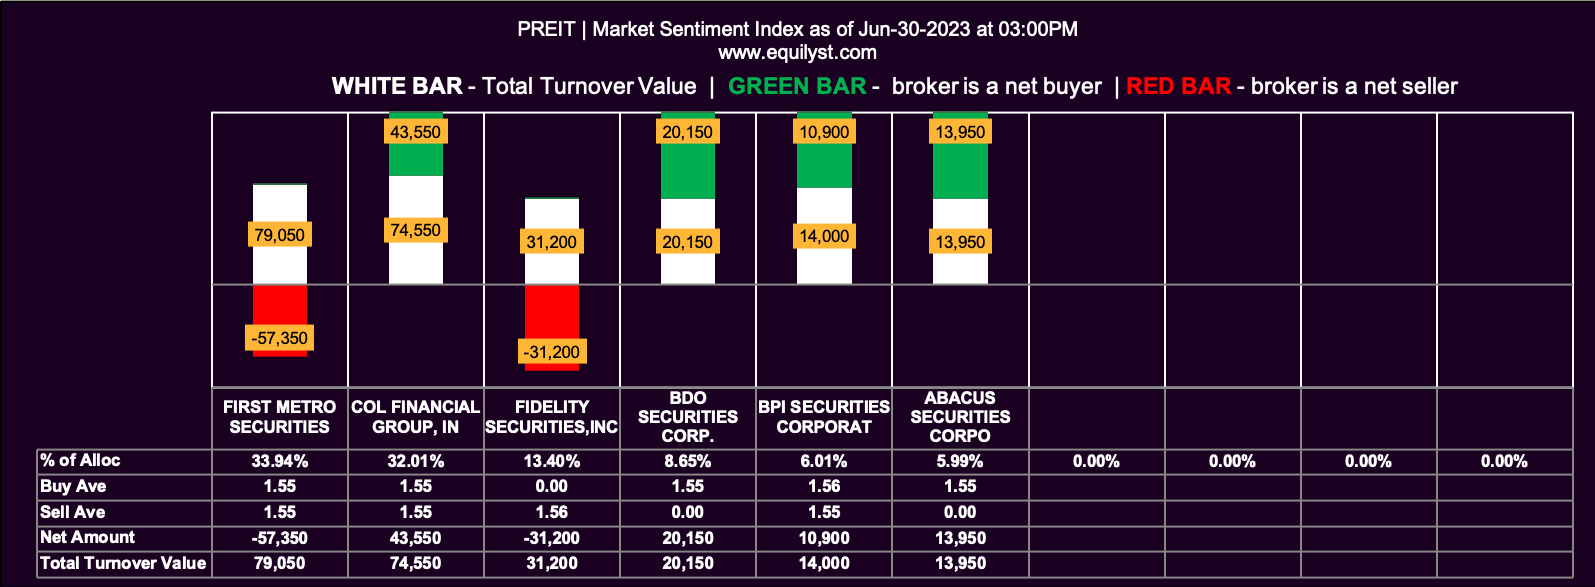
PREIT
Dominant Range Index: BEARISH
Last Price: 1.55
VWAP: 1.55
Dominant Range: 1.55 – 1.55
Market Sentiment Index: BULLISH
4 of the 6 participating brokers, or 66.67% of all participants, registered a positive Net Amount
4 of the 6 participating brokers, or 66.67% of all participants, registered a higher Buying Average than Selling Average
6 Participating Brokers’ Buying Average: ₱1.55202
6 Participating Brokers’ Selling Average: ₱1.55250
2 out of 6 participants, or 33.33% of all participants, registered a 100% BUYING activity
1 out of 6 participants, or 16.67% of all participants, registered a 100% SELLING activity
Do You Need Help Trading or Investing on Stocks Mentioned in this Report?
Fix and rebalance your stock portfolio for optimal returns through our Stock Portfolio Rehabilitation Program.
Be a TITANIUM client to learn how to preserve capital, protect gains, and prevent unbearable losses when trading and investing in the Philippine stock market.
Be a PLATINUM client to request our in-depth technical analysis with recommendations tailored-it to your entry price, average cost, buy case, and risk tolerance.
Be a GOLD client to have a teleconsultation with us over the phone as trading happens.
- MA, BDO, ALI, URC, PX: Is Their Dominant Range Pointing to a Breakout? - March 14, 2025
- Tracking Market Sentiment: MTD Ratings for 30 Bluechip Stocks (March 2025) - March 13, 2025
- PSEi Stalls Below 6,260 as Market Awaits Political Shift - March 12, 2025


