Which airline stock will you buy if you choose between Cebu Air (CEB) and PAL Holdings (PAL)?
I’ll do a technical analysis for both stocks to make your decision-making process easier.
In this technical analysis, I will score both stocks regarding the number of bullish indicators they will get.
These are the indicators I will use:
- position of the last price relative to its 10-day simple moving average (SMA)
- position of the moving average convergence divergence (MACD) relative to the position of the signal line
- size of the last volume relative to the size of the 50% of the stock’s 10-day volume average
- position of the last price relative to the position of the volume-weighted average price (VWAP)
- status of the Dominant Range Index (trade-volume distribution analysis)
- status of the Market Sentiment Index (market sentiment analysis)
I’ll start with Cebu Air (CEB).
Cebu Air (CEB) Technical Analysis
Last Price vs. 10-day SMA
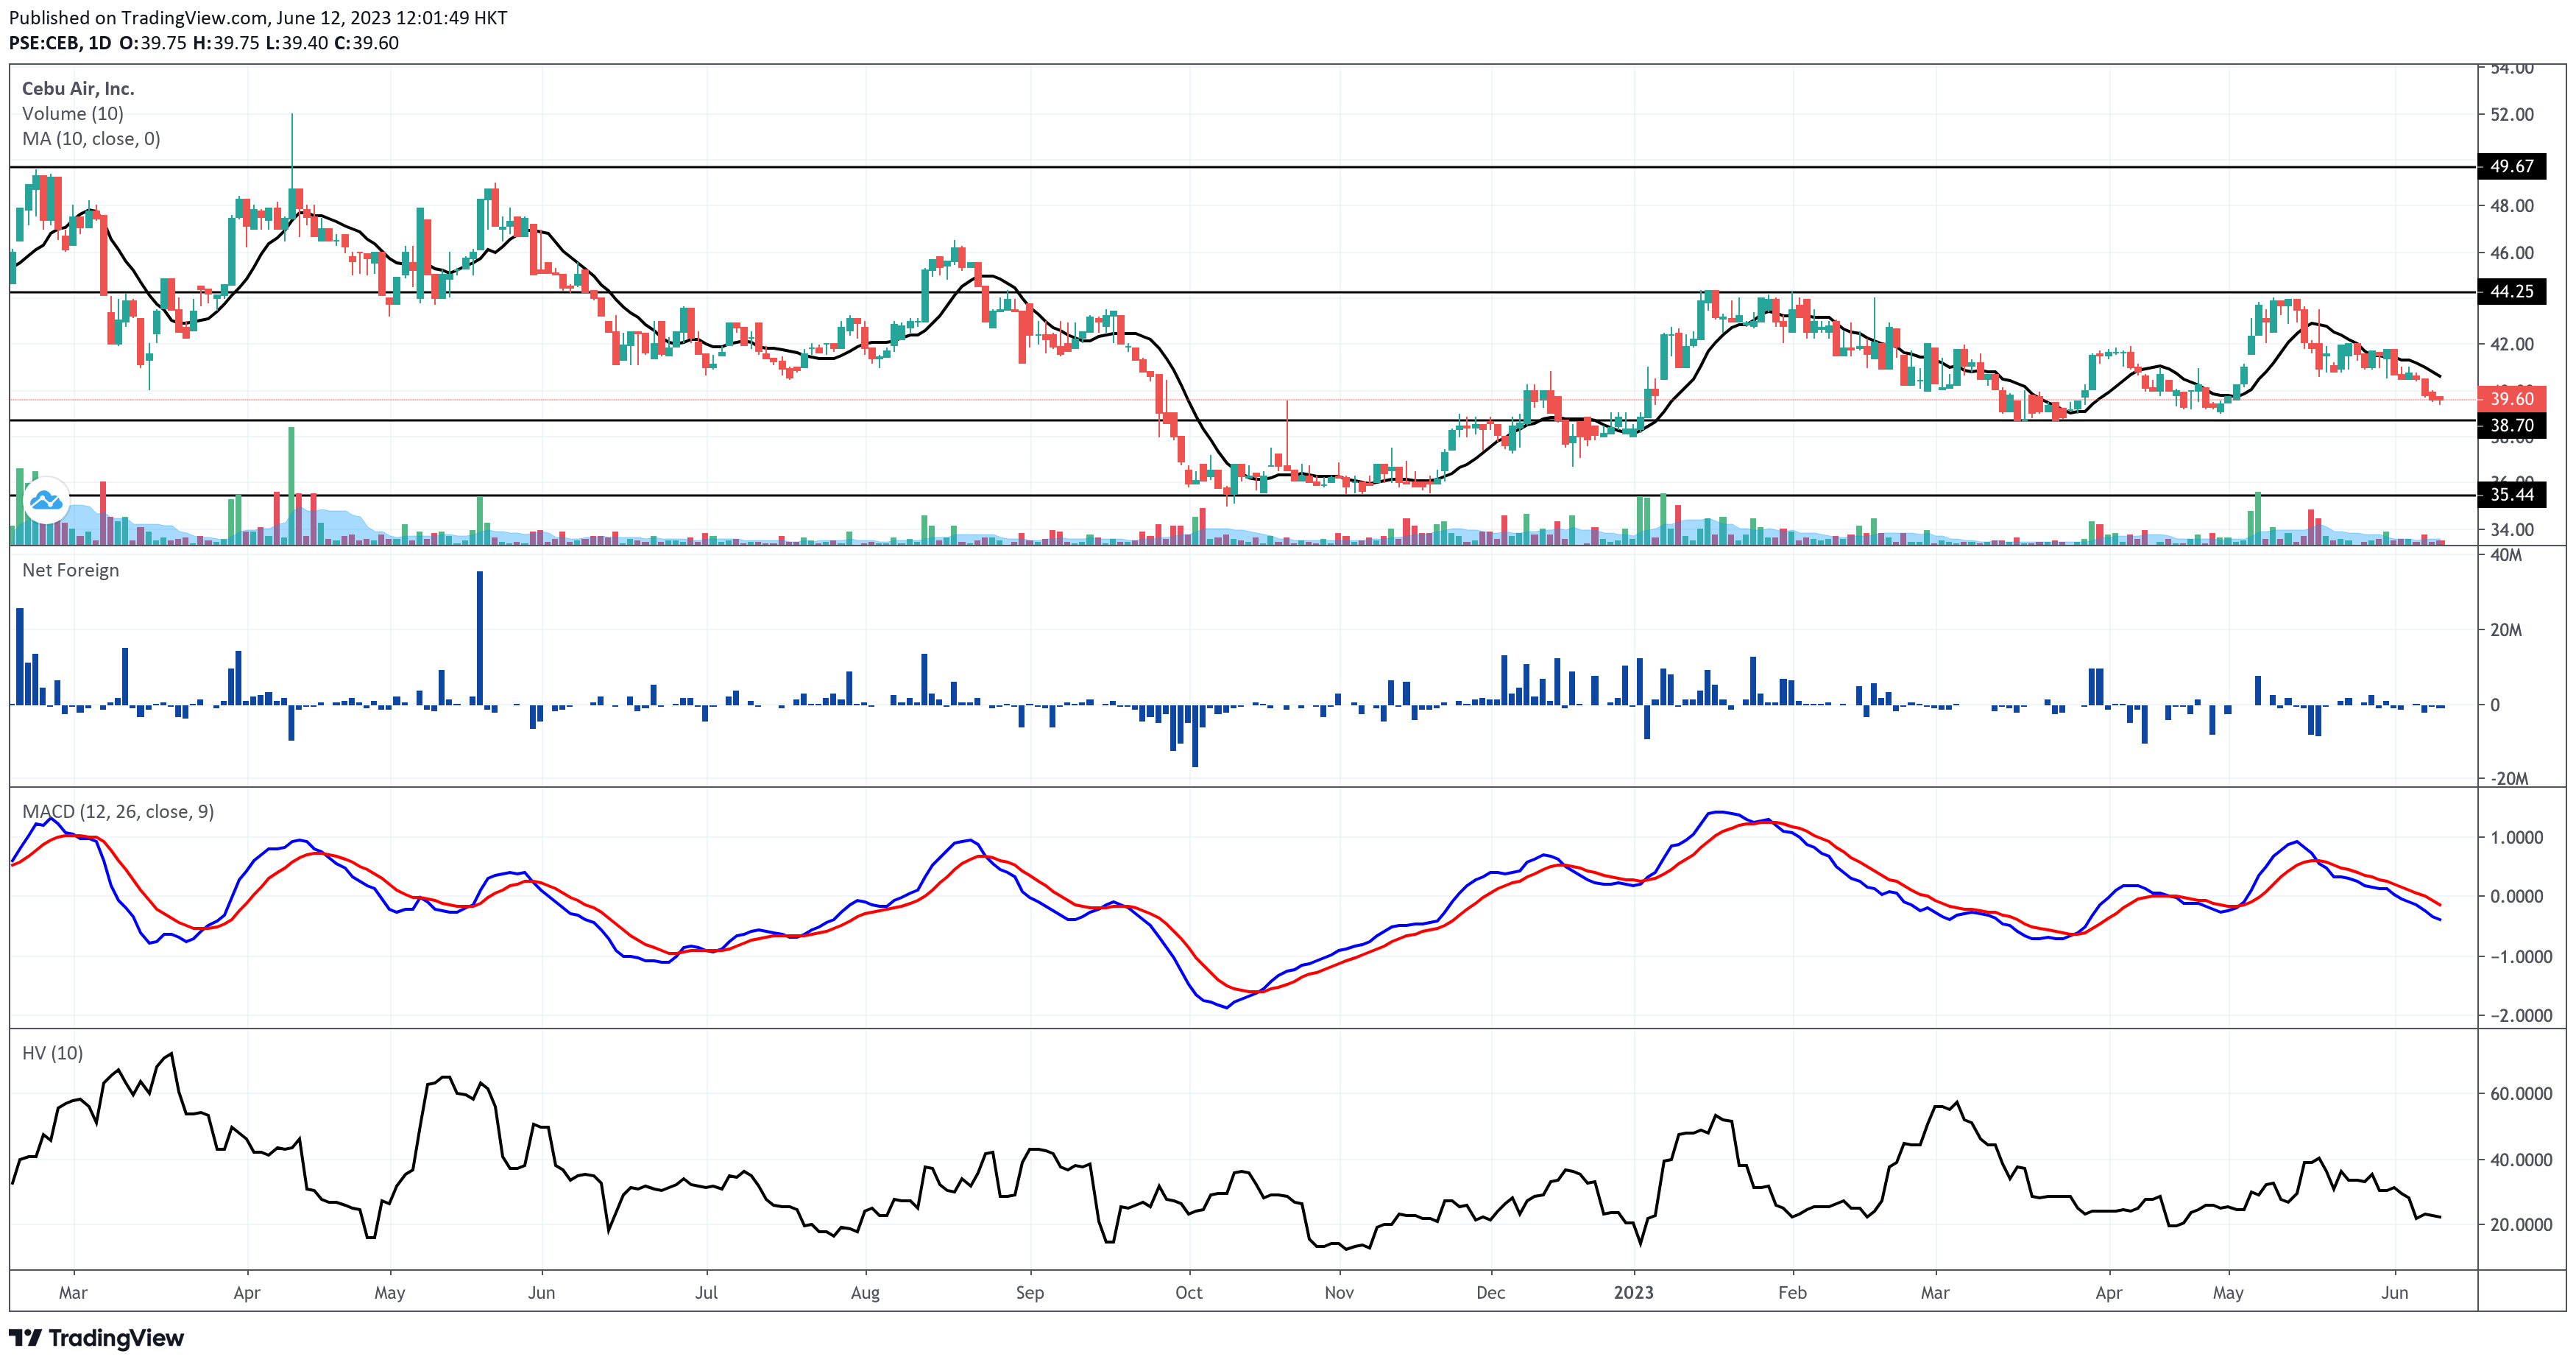
CEB closed on June 9, 2023 at P39.60 per share, unchanged from the previous trading day’s closing price.
Support is at P38.70, while resistance is at P44.25. CEB’s last price is closer to immediate support than resistance.
This stock is trading below its 10-day SMA.
CEB gets a bearish score for this criterion.
MACD vs. Signal Line
CEB’s MACD is trading below the signal and zero lines. I do not see a formation of a bullish convergence between the MACD and signal lines.
That’s a bearish point for CEB.
Last Volume Vs. 10-day Volume Average
CEB printed a red volume bar higher than 50% of the stock’s 10-day volume average last June 9, 2023.
Since it’s a red volume bar, CEB gets another bearish score for this criterion.
Last Price vs. VWAP
CEB’s last price of P39.60 is higher than last Friday’s VWAP of P39.56.
Finally, CEB gets a bullish score.
When the last price is higher than the volume-weighted average price (VWAP), it means that the most recent transaction or trade occurred at a price higher than the average price at which all the trades took place throughout the day, weighted by their respective trading volumes.
The VWAP is a commonly used benchmark in trading and represents the average price at which a security has traded over a given period, typically within a day. It considers both the prices at which trades occurred and the volume of shares traded at each price.
If the last price is higher than the VWAP, it suggests that the most recent transaction was executed at a price higher than the average price of all the trades for that day. This could indicate strong buying pressure or a surge in demand for the security, as buyers are willing to pay a premium to acquire the shares.
Dominant Range Index
Dominant Range Index: BULLISH
Last Price: 39.6
VWAP: 39.56
Dominant Range: 39.6 – 39.6
CEB gets its second bullish score.
Market Sentiment Index (June 9, 2023)
Market Sentiment Index: BULLISH
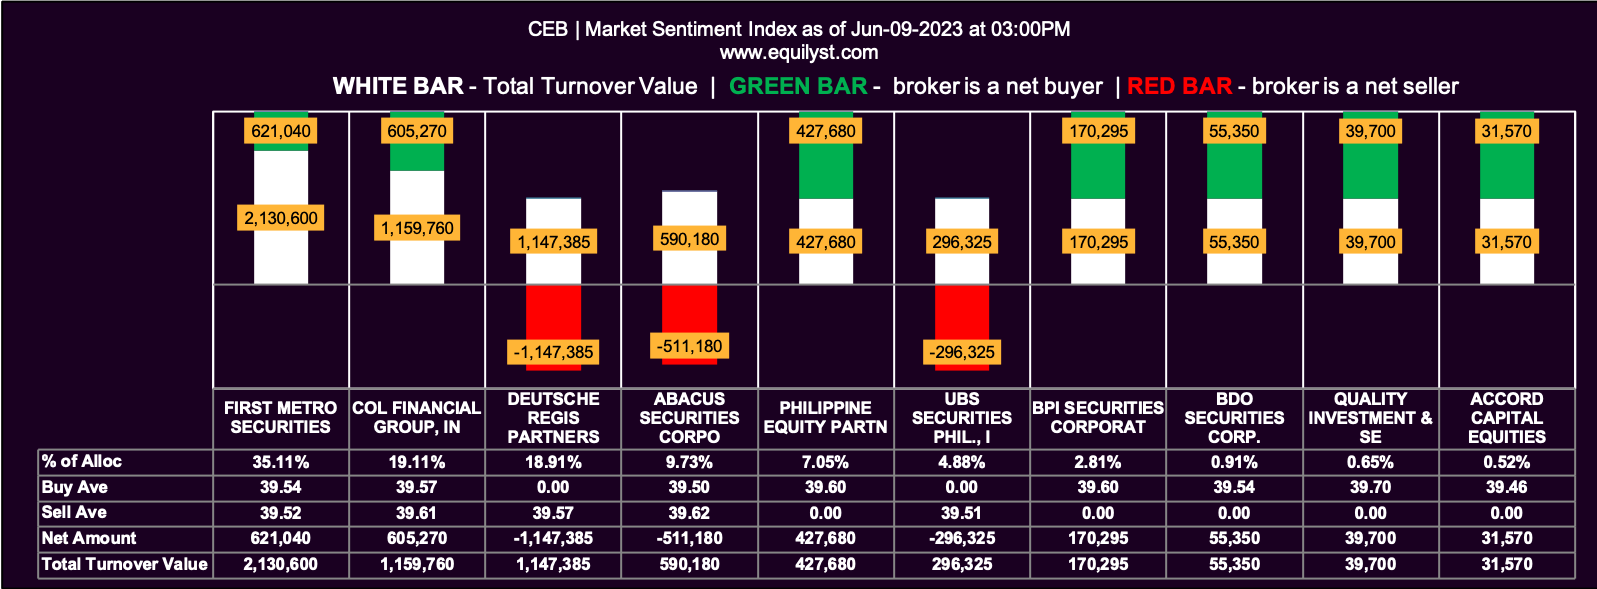
8 of the 11 participating brokers, or 72.73% of all participants, registered a positive Net Amount
7 of the 11 participating brokers, or 63.64% of all participants, registered a higher Buying Average than Selling Average
11 Participating Brokers’ Buying Average: ₱39.56239
11 Participating Brokers’ Selling Average: ₱39.53600
5 out of 11 participants, or 45.45% of all participants, registered a 100% BUYING activity
2 out of 11 participants, or 18.18% of all participants, registered a 100% SELLING activity
This is the third bullish score for CEB.
I’ll take a look at the month-to-date Market Sentiment Index for CEB.
Market Sentiment Index (June 1, 2023 to June 9, 2023)
Market Sentiment Index: BULLISH
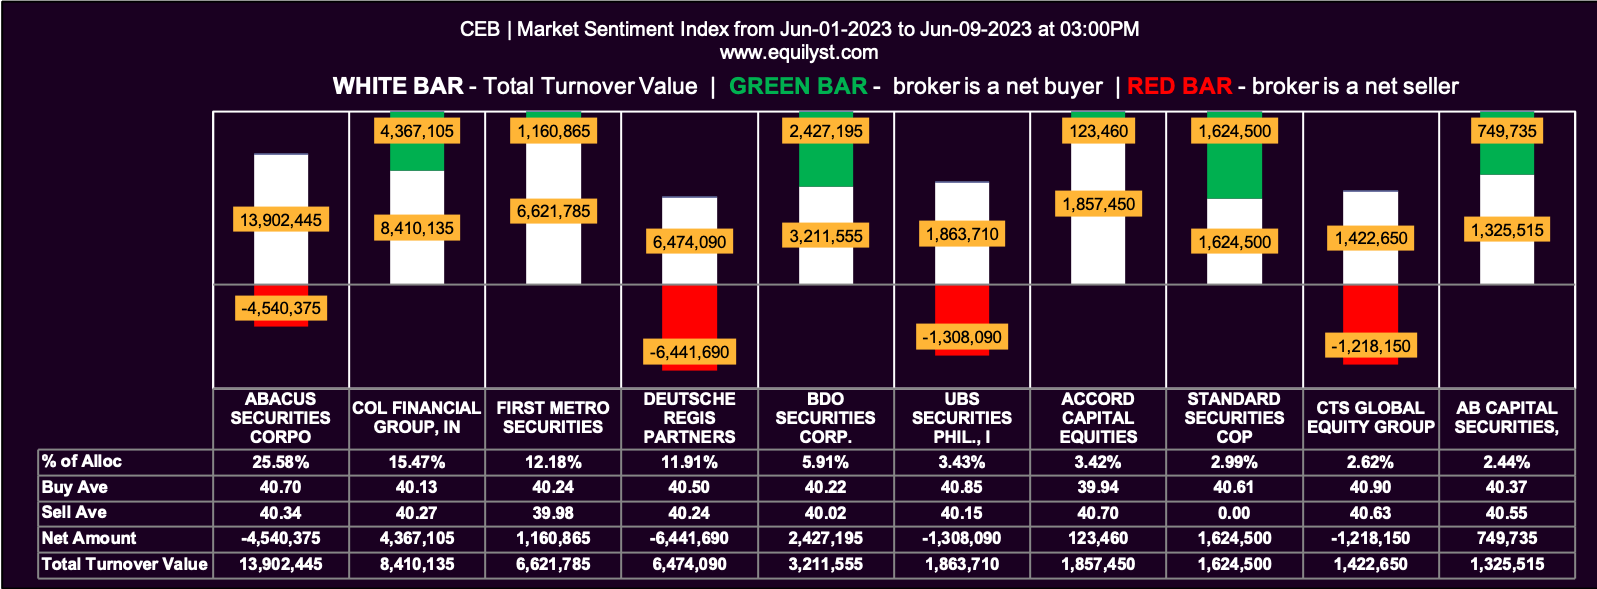
26 of the 33 participating brokers, or 78.79% of all participants, registered a positive Net Amount
23 of the 33 participating brokers, or 69.70% of all participants, registered a higher Buying Average than Selling Average
33 Participating Brokers’ Buying Average: ₱40.26681
33 Participating Brokers’ Selling Average: ₱40.32083
14 out of 33 participants, or 42.42% of all participants, registered a 100% BUYING activity
3 out of 33 participants, or 9.09% of all participants, registered a 100% SELLING activity
CEB bags its fourth bullish point.
Final Score for CEB
Bearish: 3
Bullish: 4
PAL Holdings (PAL) Technical Analysis
I’ll start analyzing PAL Holdings (PAL) now.
Last Price vs. 10-day SMA
PAL had no trading activity last Friday, June 9, 2023.
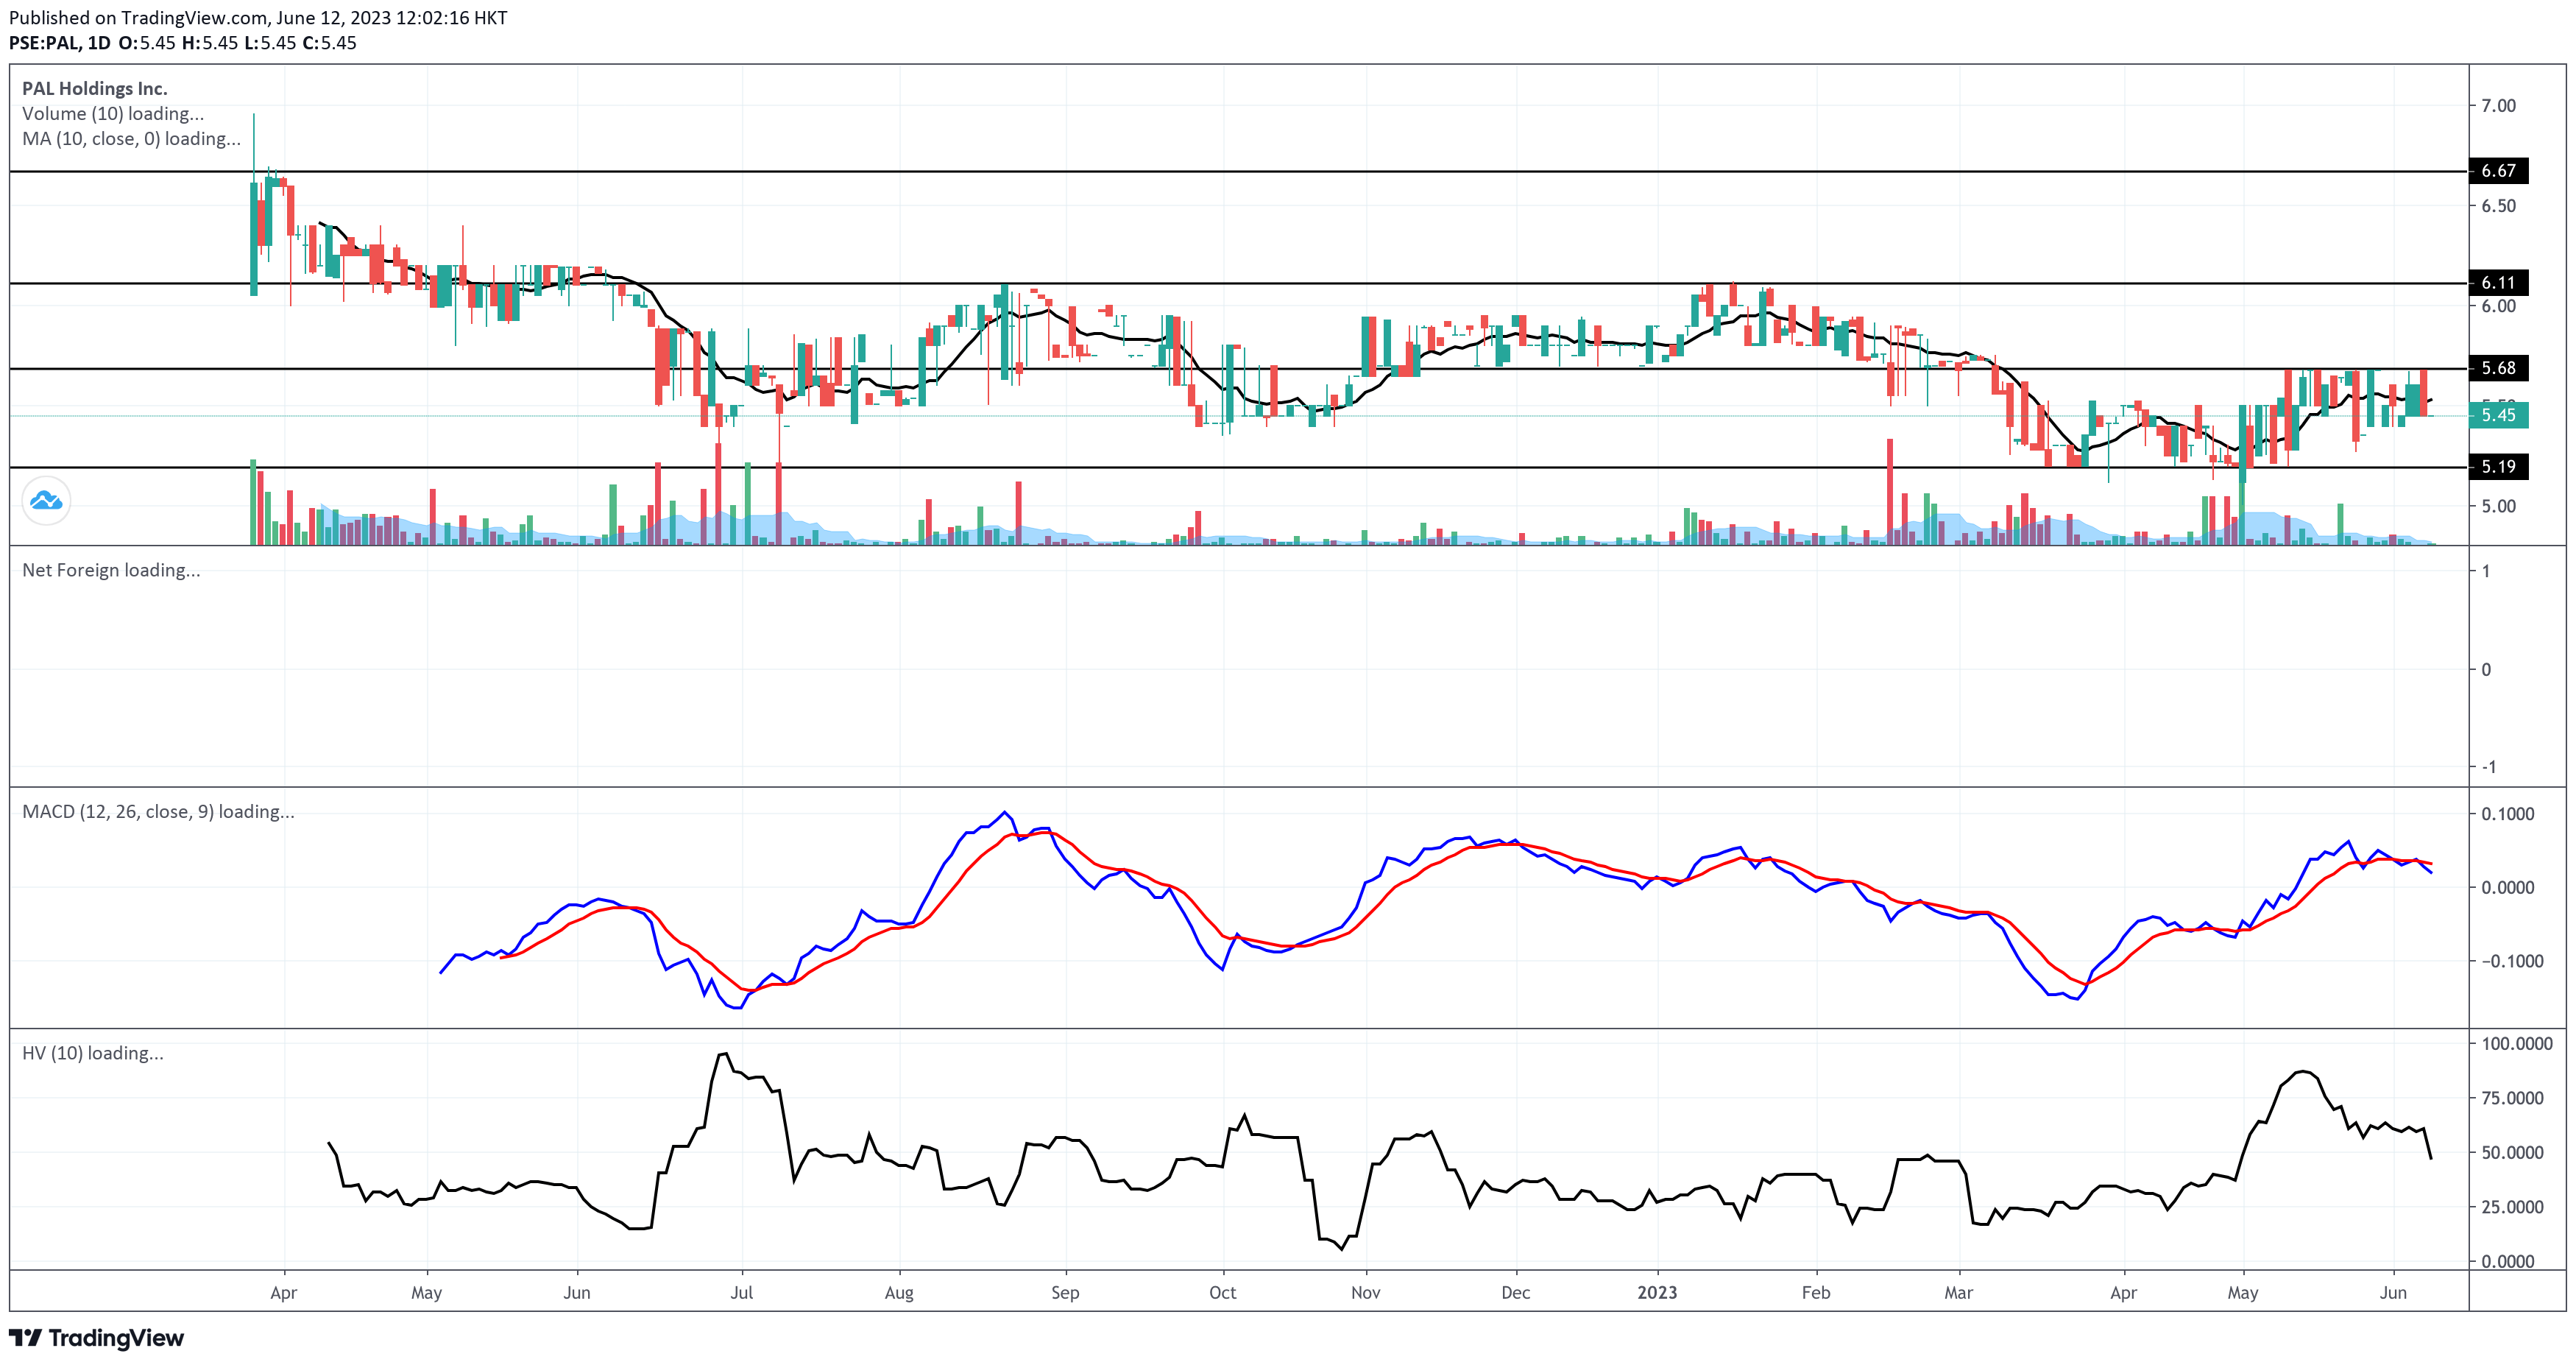
It closed on June 8, 2023 at P5.45 per share, unchanged from its previous closing price. PAL mirrors the “unchanged” Day Change of CEB’s last trading day.
CEB’s main support is near P5.19, while the immediate resistance is at P5.68.
The last price is closer to the support than the resistance.
However, just like PAL, CEB also trades below its 10-day SMA.
So, PAL gets its first bearish score.
MACD vs. Signal Line
PAL registered a death cross on its MACD histogram on June 6, 2023. That means it gets another bearish point for this criterion.
Last Volume Vs. 10-day Volume Average
PAL’s last volume bar is green, but it’s so slim that it failed to cross above 50% of PAL’s 10-day volume average. It’s a bearish score.
If the last price is green, but the volume is less than 50% of the stock’s 10-day volume average, the ascent is less likely to continue.
The surge will likely grow if the last price is green but the volume is higher than 50% of the stock’s 10-day volume average.
In the same way, when the last price is red, but the volume is less than 50% of the stock’s 10-day volume average, there’s a chance for the descent in price to come to a pause and reverse its direction due to the lack of appetite to pursue the selling pressure.
If the last price is red, but the volume is higher than 50% of the stock’s 10-day volume average, the bearishness is likelier to get worse.
Last Price vs. VWAP
Since PAL’s opening, closing, intraday high, and intraday low prices were all at P5.45 last June 8, its VWAP is also at P5.45.
That also means the last price is the same as the VWAP.
That’s a bearish score for this criterion.
Dominant Range Index
The Dominant Range Index score is inapplicable in this case. So, it’s no one’s score for this criterion.
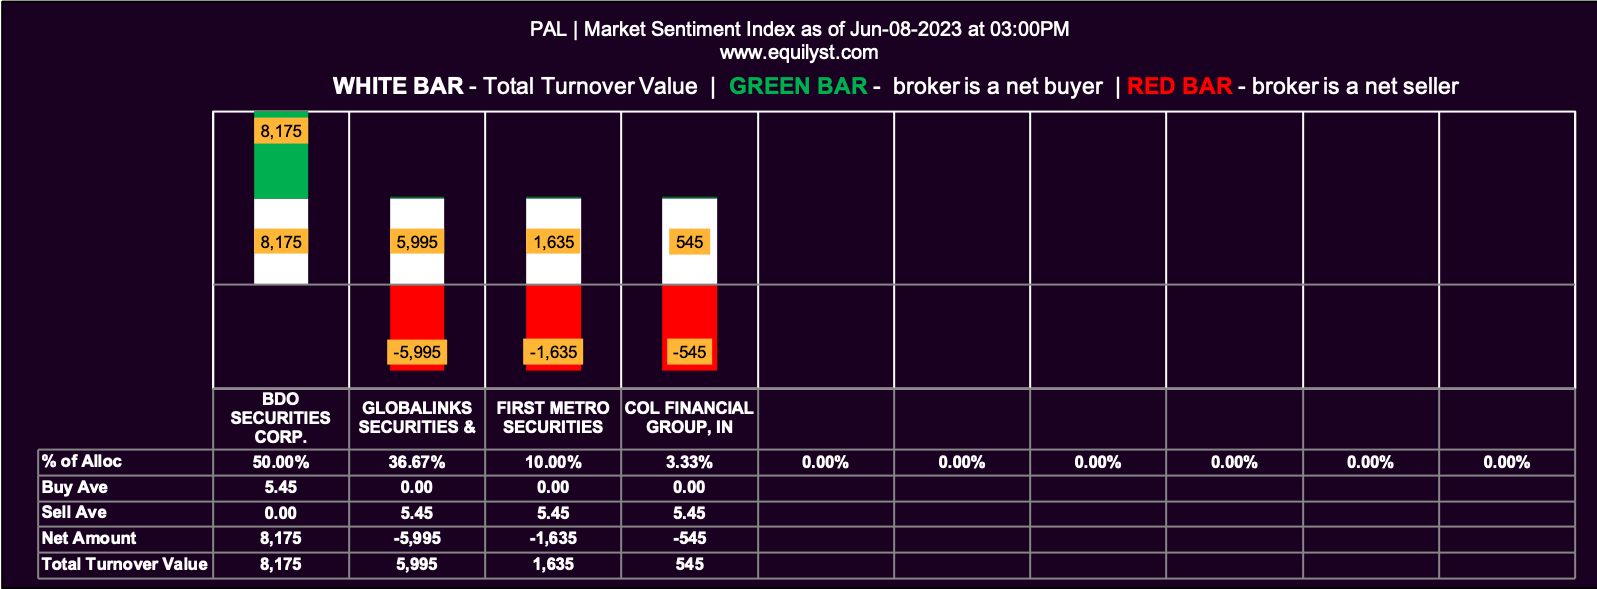
Market Sentiment Index (June 8, 2023)
Market Sentiment Index: BEARISH
1 of the 4 participating brokers, or 25.00% of all participants, registered a positive Net Amount
1 of the 4 participating brokers, or 25.00% of all participants, registered a higher Buying Average than Selling Average
4 Participating Brokers’ Buying Average: ₱5.45000
4 Participating Brokers’ Selling Average: ₱5.45000
1 out of 4 participants, or 25.00% of all participants, registered a 100% BUYING activity
3 out of 4 participants, or 75.00% of all participants, registered a 100% SELLING activity
That’s another bearish score for PAL.
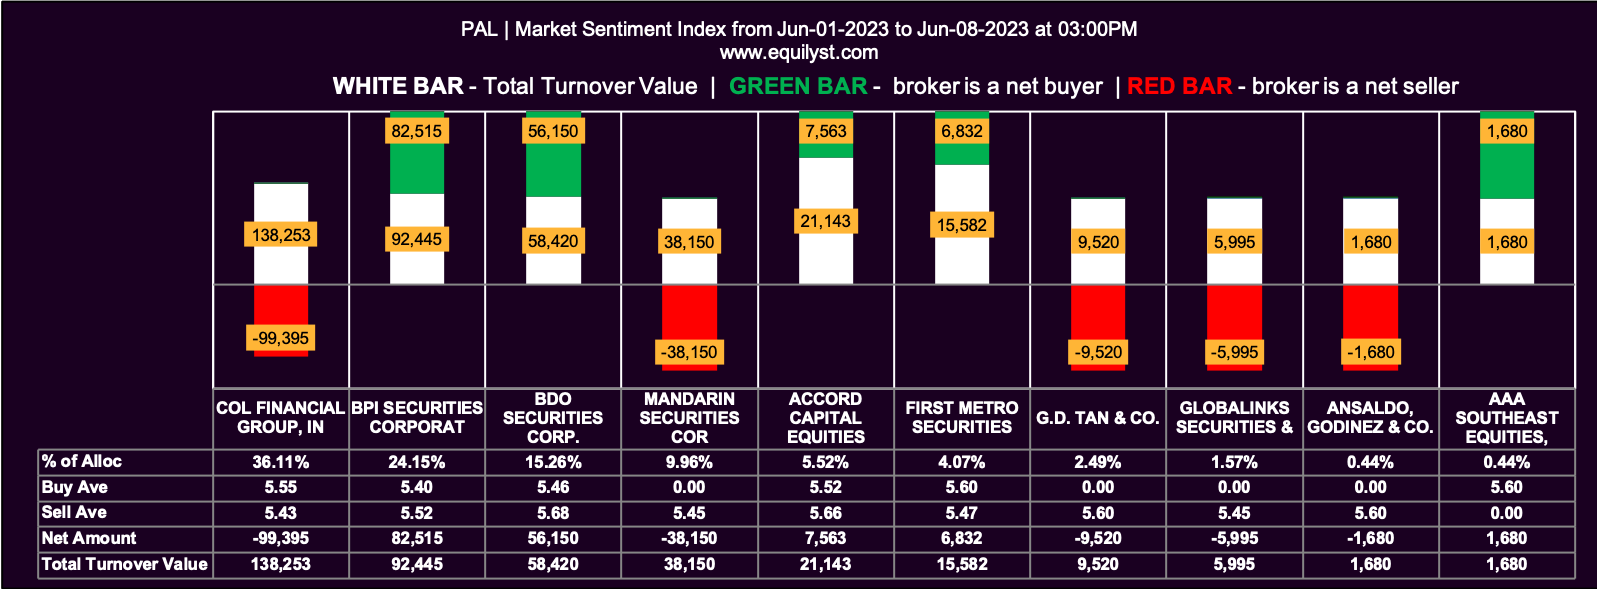
Market Sentiment Index (June 1, 2023 to June 8, 2023)
Market Sentiment Index: BULLISH
5 of the 10 participating brokers, or 50.00% of all participants, registered a positive Net Amount
3 of the 10 participating brokers, or 30.00% of all participants, registered a higher Buying Average than Selling Average
10 Participating Brokers’ Buying Average: ₱5.52178
10 Participating Brokers’ Selling Average: ₱5.53829
1 out of 10 participants, or 10.00% of all participants, registered a 100% BUYING activity
4 out of 10 participants, or 40.00% of all participants, registered a 100% SELLING activity
The month-to-date market sentiment for PAL is bullish. This is the only bullish point of PAL.
Final Score for PAL
Bearish: 6
Bullish: 1
Verdict
CEB gets more bullish points than PAL. In this scoring system, CEB wins.
But winning this scoring system doesn’t mean buying the stock right away.
I did a comparative analysis or review of both stocks using my way of doing technical analysis.
Which Between CEB and PAL Has a Buy Signal?
None.
They failed to secure a confirmed buy signal from my Evergreen Strategy’s algorithm.
Which Between CEB and PAL Is a Better Addition to Your Watchlist?
CEB has a better historical volume than PAL. The total turnover value or volume size is one of my stock selection criteria.
What to Do Now?
Whether you want to monitor one or both, the bottom line is that you should wait for a confirmed buy signal according to whatever data-driven methodology you’re using.
The operative phrase is “data-driven methodology, ” not just an instinct-based, superstitious strategy.
If you’re one of my clients, here’s what you need to remember:
1. Monitor which one gets a confirmed buy signal first according to my Evergreen Strategy’s algorithm. If you have remaining Stock Analysis Request credits, you may use two credits to request my latest analysis for both stocks.
2. Once a confirmed buy signal is issued, calculate your initial trailing stop and reward-to-risk ratio.
3. If you’re happy with the reward-to-risk ratio, do a test-buy within the prevailing dominant range, which you will get from me.
You want to know how to make a planned entry and exit strategy when trading or investing in the Philippine stock market.
I can teach you online. Check out the stock market consultancy service of Equilyst Analytics here.
- MA, BDO, ALI, URC, PX: Is Their Dominant Range Pointing to a Breakout? - March 14, 2025
- Tracking Market Sentiment: MTD Ratings for 30 Bluechip Stocks (March 2025) - March 13, 2025
- PSEi Stalls Below 6,260 as Market Awaits Political Shift - March 12, 2025


