Petron Corporation (PCOR) Technical Analysis
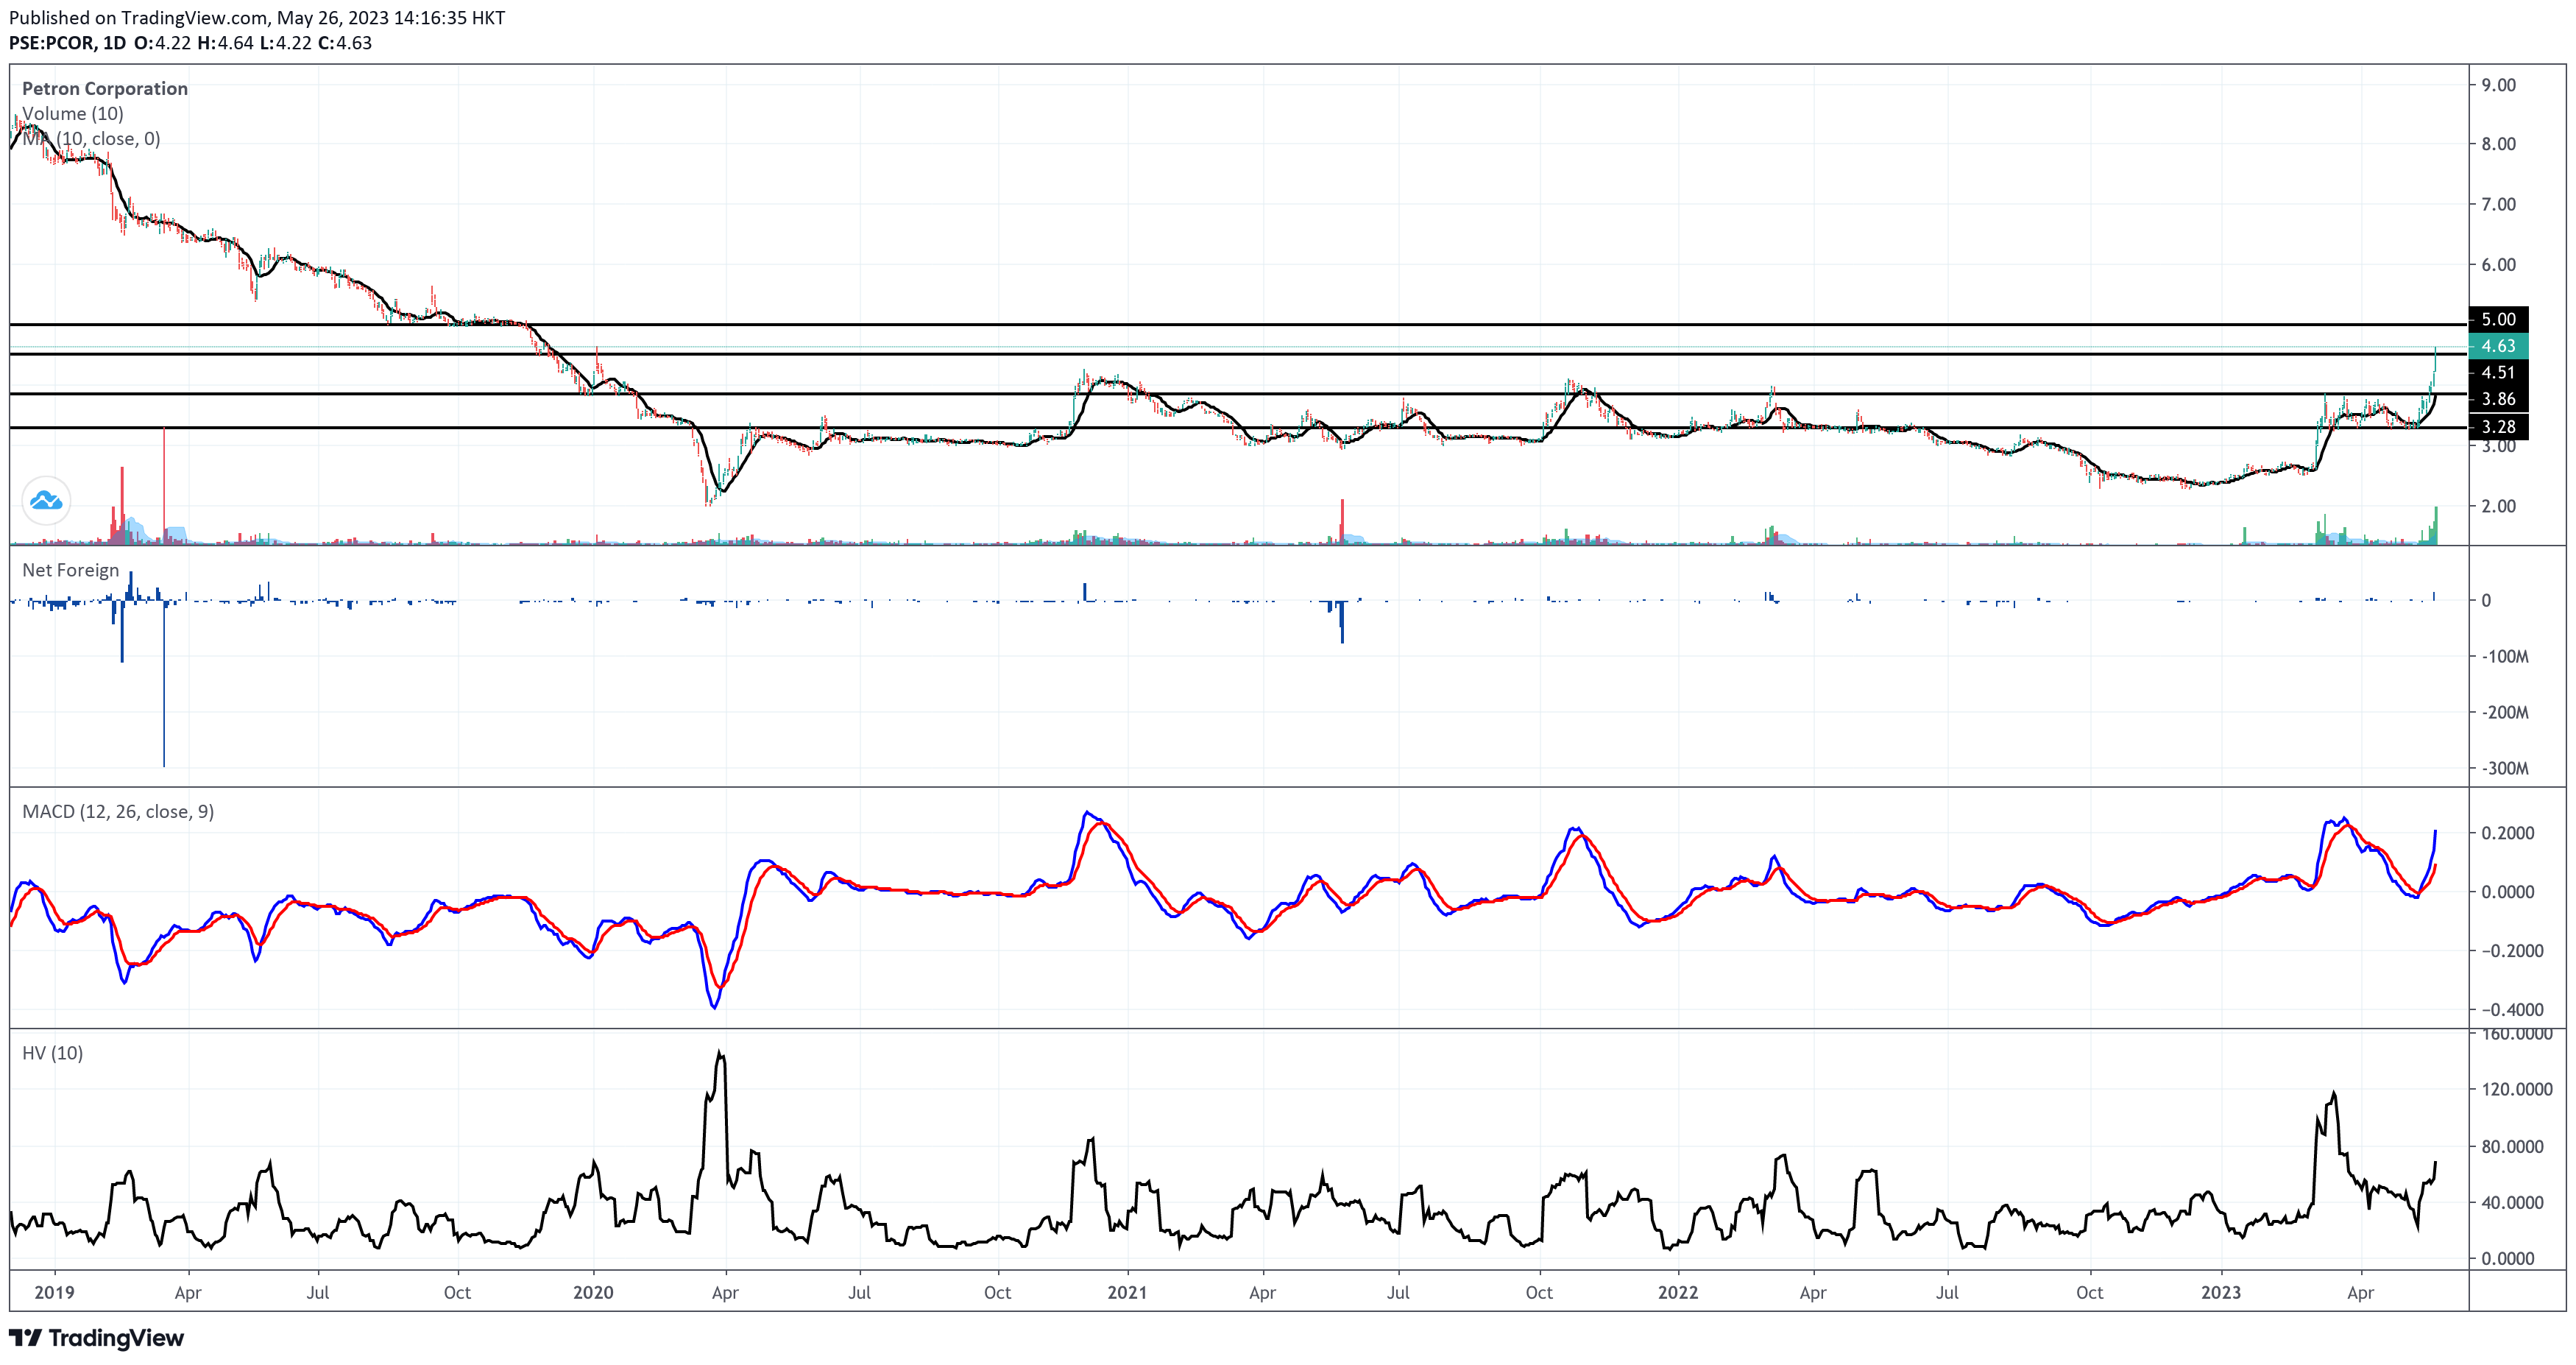
Petron Corporation (PCOR) is up by 94.17% from its 2022 closing price of P2.40 per share to its prevailing price of P4.66 apiece.
This industrial company was trading between P3.20 and P3.90 from March 2023 until the second week of May 2023 when it broke above the resistance at P3.90.
PCOR gained a strong volume higher than 100% of its 10-day volume average today, May 26, leading to the breakout above the resistance at P4.50, making that price point its latest immediate support level.
PCOR’s immediate historical resistance point is parked near P5.00 per share. The last time I saw PCOR above the P5.00-apiece level was in November 2019.
Despite the P183 million total traded value of PCOR as of this analysis, PCOR failed to register a net foreign buying score. PCOR is on a net foreign selling worth P6.5 million as of 2:55 PM Philippine time on May 26, 2023.
Year-to-date, PCOR remains in the net foreign buying status at a little less than half a million pesos. That’s nowhere near a significant amount. Therefore, I won’t consider much of the foreign investors’ sentiment on PCOR.
This stock has been showing an impressive volume for nine (9) consecutive trading days. They’re all higher than the stock’s 10-day volume average. If this buying appetite continues with this volume, we might see PCOR wobble closer to P5.00.
Just as its price is trading above its 10-day volume average, the moving average convergence divergence (MACD) line continues to move away from its signal line. The bullish divergence continues.
Due to the relatively aggressive price surge of PCOR, its 10-day historical volatility score has issued a friendly warning to all aggressive buyers. PCOR has already entered high-risk territory as far as the erraticity of its price action is concerned.
Trade and Volume Analysis
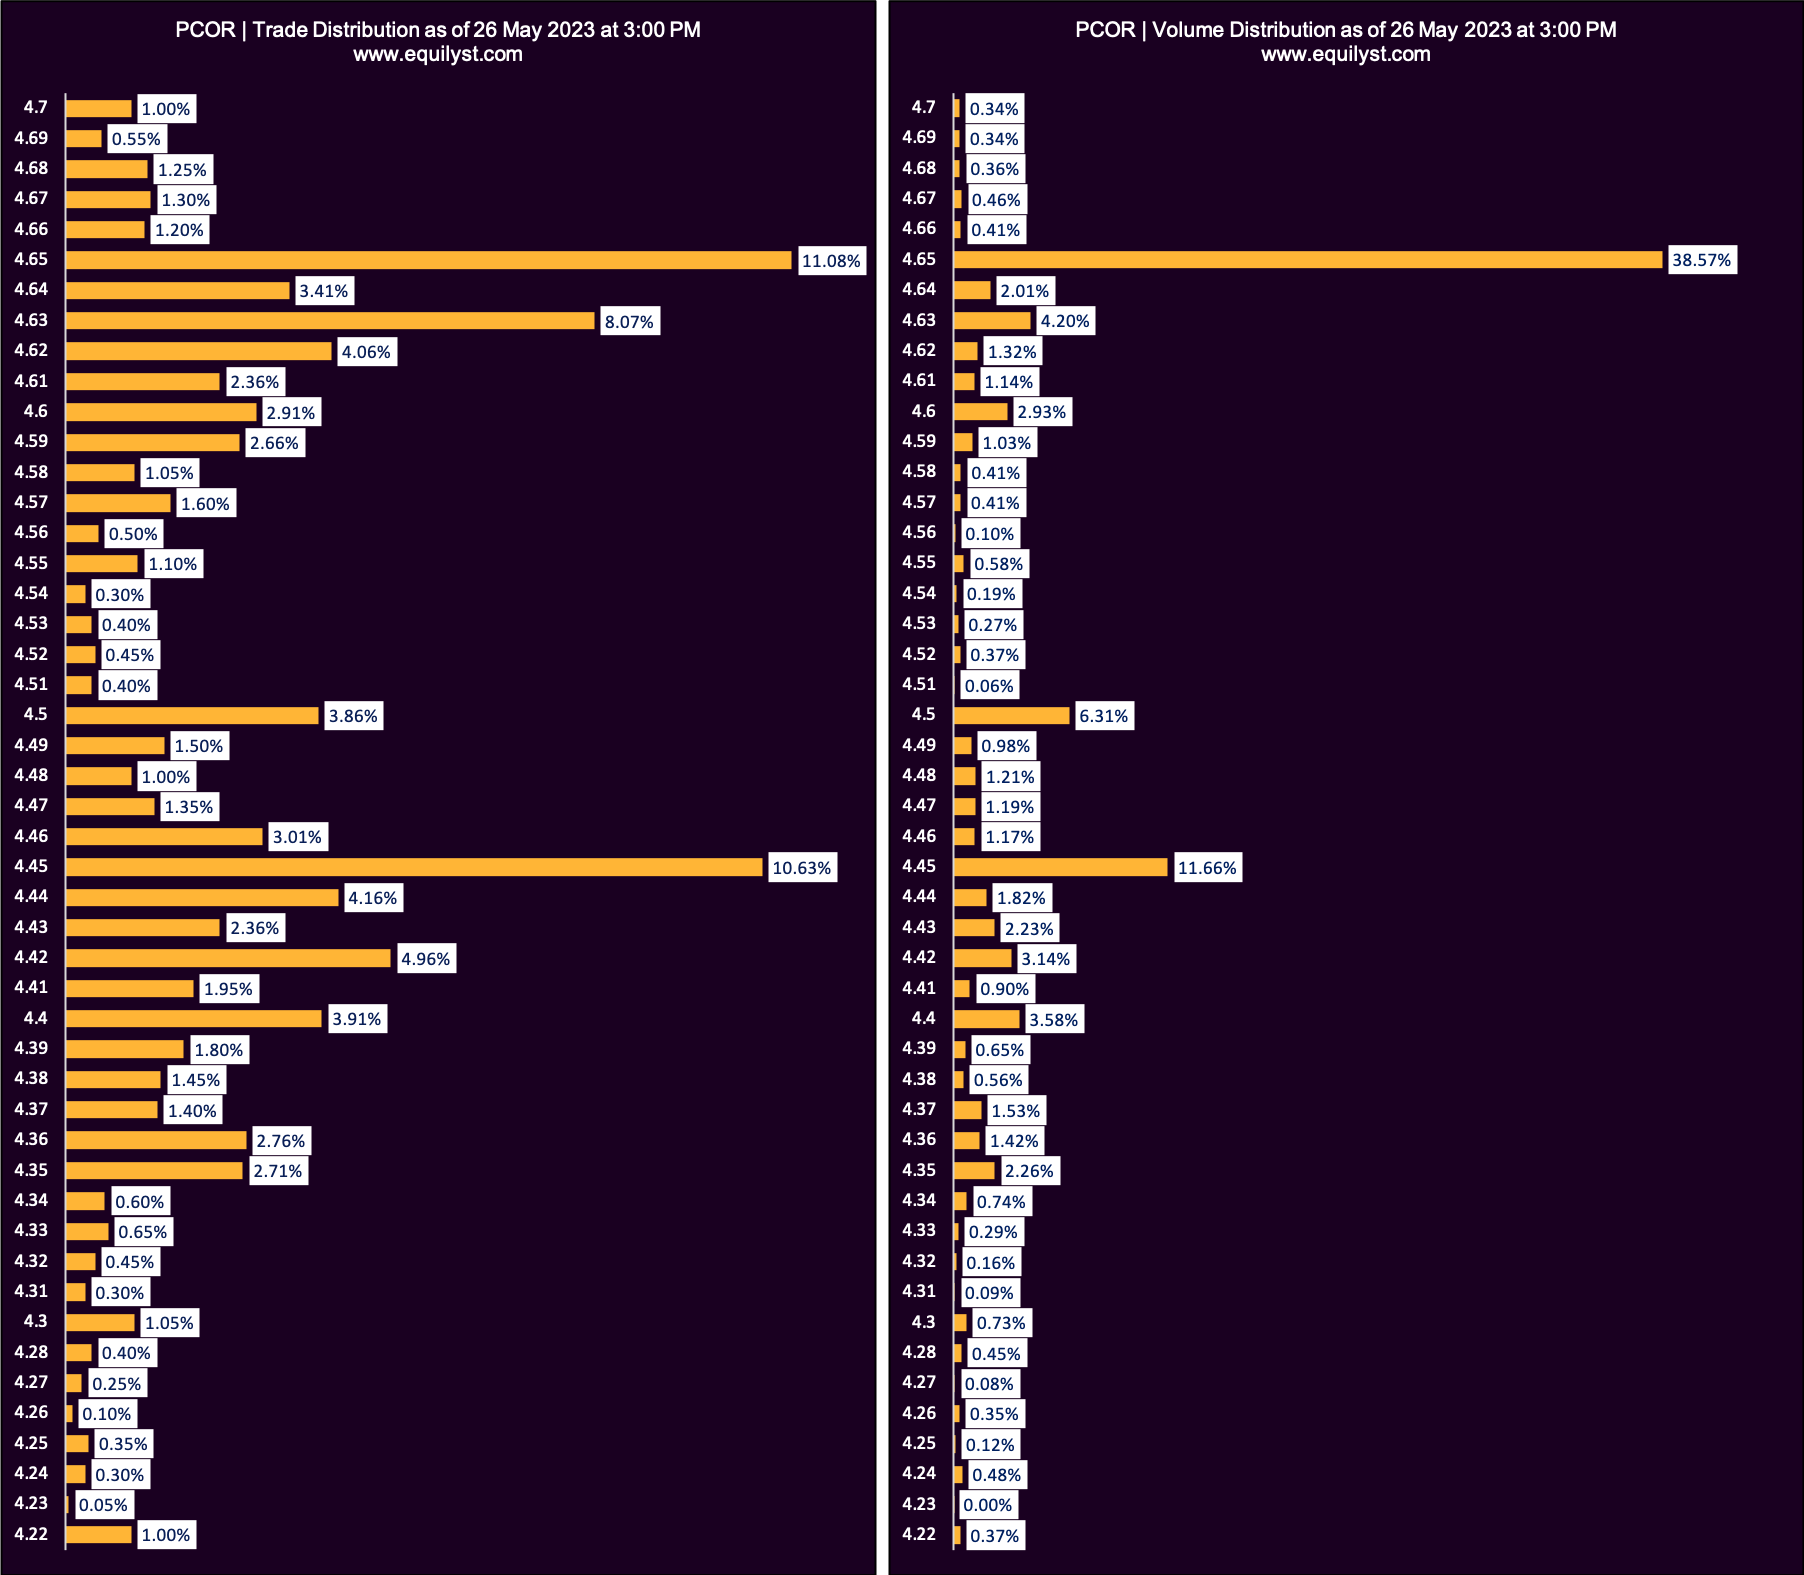
Dominant Range Index: BULLISH
Last Price: 4.65
VWAP: 4.54
Dominant Range: 4.65 – 4.65
Market Sentiment Analysis
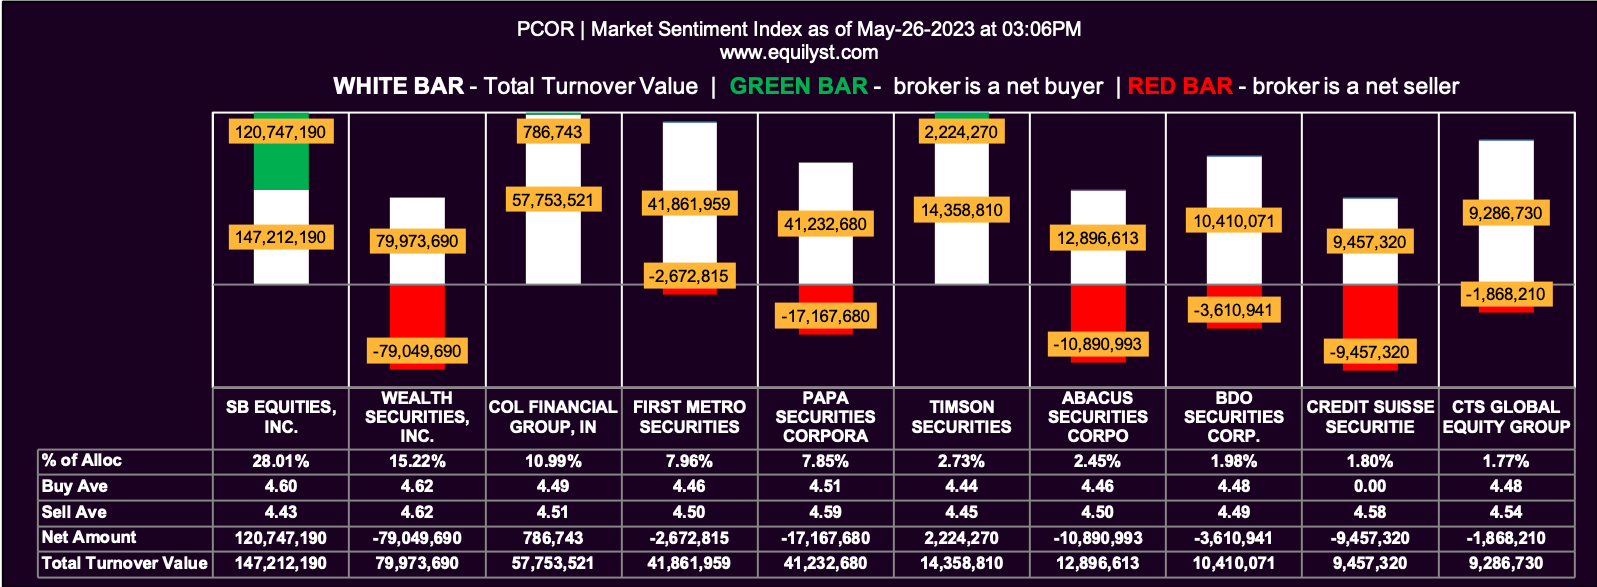
Market Sentiment Index: BULLISH
24 of the 71 participating brokers, or 33.80% of all participants, registered a positive Net Amount
31 of the 71 participating brokers, or 43.66% of all participants, registered a higher Buying Average than Selling Average
71 Participating Brokers’ Buying Average: ₱4.50759
71 Participating Brokers’ Selling Average: ₱4.49294
10 out of 71 participants, or 14.08% of all participants, registered a 100% BUYING activity
22 out of 71 participants, or 30.99% of all participants, registered a 100% SELLING activity
Verdict
All indicators that form my Evergreen Strategy in Trading and Investing in the Philippine Stock Market are bullish. That means there’s a buy signal.
But there’s one thing you need to do before you hit the BUY button.
You must calculate your initial trailing stop and reward-to-risk ratio. Click HERE to use my calculators for free.
Buy some PCOR shares if, and only if, you’re satisfied with your reward-to-risk ratio.
Please do not ask me what an acceptable reward-to-risk ratio is. There’s no universal answer to that. All of us have our risk appetite. The reward-to-risk ratio that will make me happy may not make you happy, and vice versa.
Sell when your trailing stop is hit. I don’t use a predefined “target selling price” when selling. My trailing stop takes care of me. You will find my trailing stop calculator on the calculators’ link I mentioned above.
Avail of my stock market consultancy service to appreciate, understand, and put into disciplined and profitable use the logic of my strategy. Click here to subscribe.
- MA, BDO, ALI, URC, PX: Is Their Dominant Range Pointing to a Breakout? - March 14, 2025
- Tracking Market Sentiment: MTD Ratings for 30 Bluechip Stocks (March 2025) - March 13, 2025
- PSEi Stalls Below 6,260 as Market Awaits Political Shift - March 12, 2025


