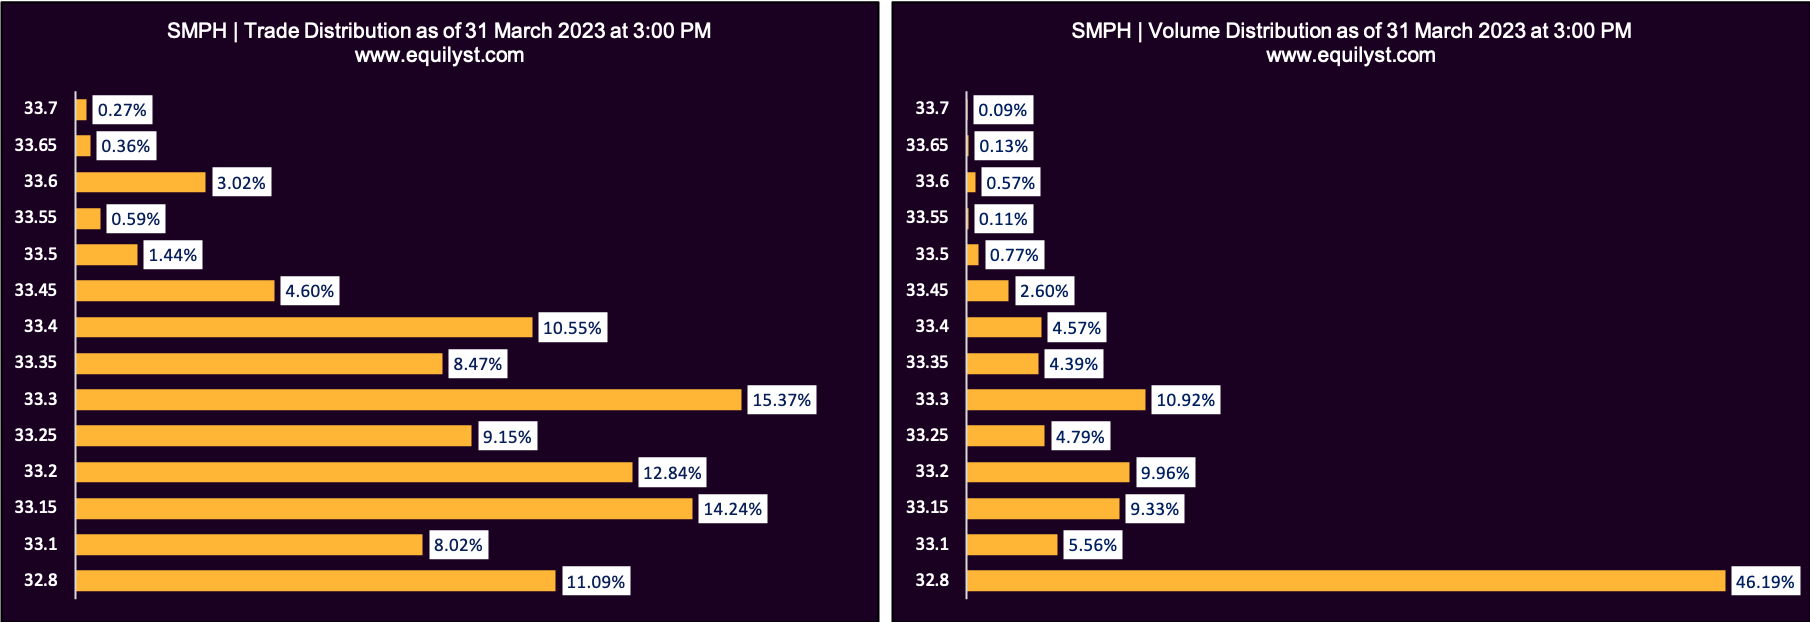
Price, volume, and trade analysis helps me identify the most logical price range for buying and selling. This is my Dominant Range analysis. I analyze two groups: trades and volume.
There are two things I’m looking at in my Dominant Range analysis. First is the position of the volume-weighted average price (VWAP) relative to the position of the current price. Second is the position of the dominant range relative to the position of the intraday high and low.
The dominant range is the range of prices that has the biggest volume and highest number of trades.
If I want to know if the participating traders and investors are interested in pushing the price higher, the dominant range must be closer to the intraday high than the intraday low.
If I want to know if the participants are wildly optimistic about buying the stock at a higher price, I check if the current price is higher than the VWAP or if the VWAP is within the dominant range that is closer to the intraday high than intraday low.
There must be a sense of balance, an equilibrium, between the size of the number of trades and volume per price, relative to the individual distribution of the number of trades and size of volume per price per group.
The finished product of this analysis is the status of my proprietary Dominant Range Index.
When my algorithm processes all the statuses of the elements I encoded, my Dominant Range Index can have a bullish or a bearish rating.
This Dominant Range Index is the 5th indicator of my 6-indicator Evergreen Strategy When Trading and Investing in the Philippine Stock Market.
Simply put, my Dominant Range Index is an application of the Nash Equilibrium effect, which is a useful theory in my professional career as a computer scientist.
I know it sounds complicated when I write a technical description of its functionality. This is the reason why I came up with a bullish or bearish overall rating for my Dominant Range analysis. If the rating is bullish, it means the price is likely to go higher. The opposite is true if the overall rating is bearish.
In this free report, I feel kind to share with you the Dominant Range Index of the following stocks as of the date and time stamps shown on their respective charts.
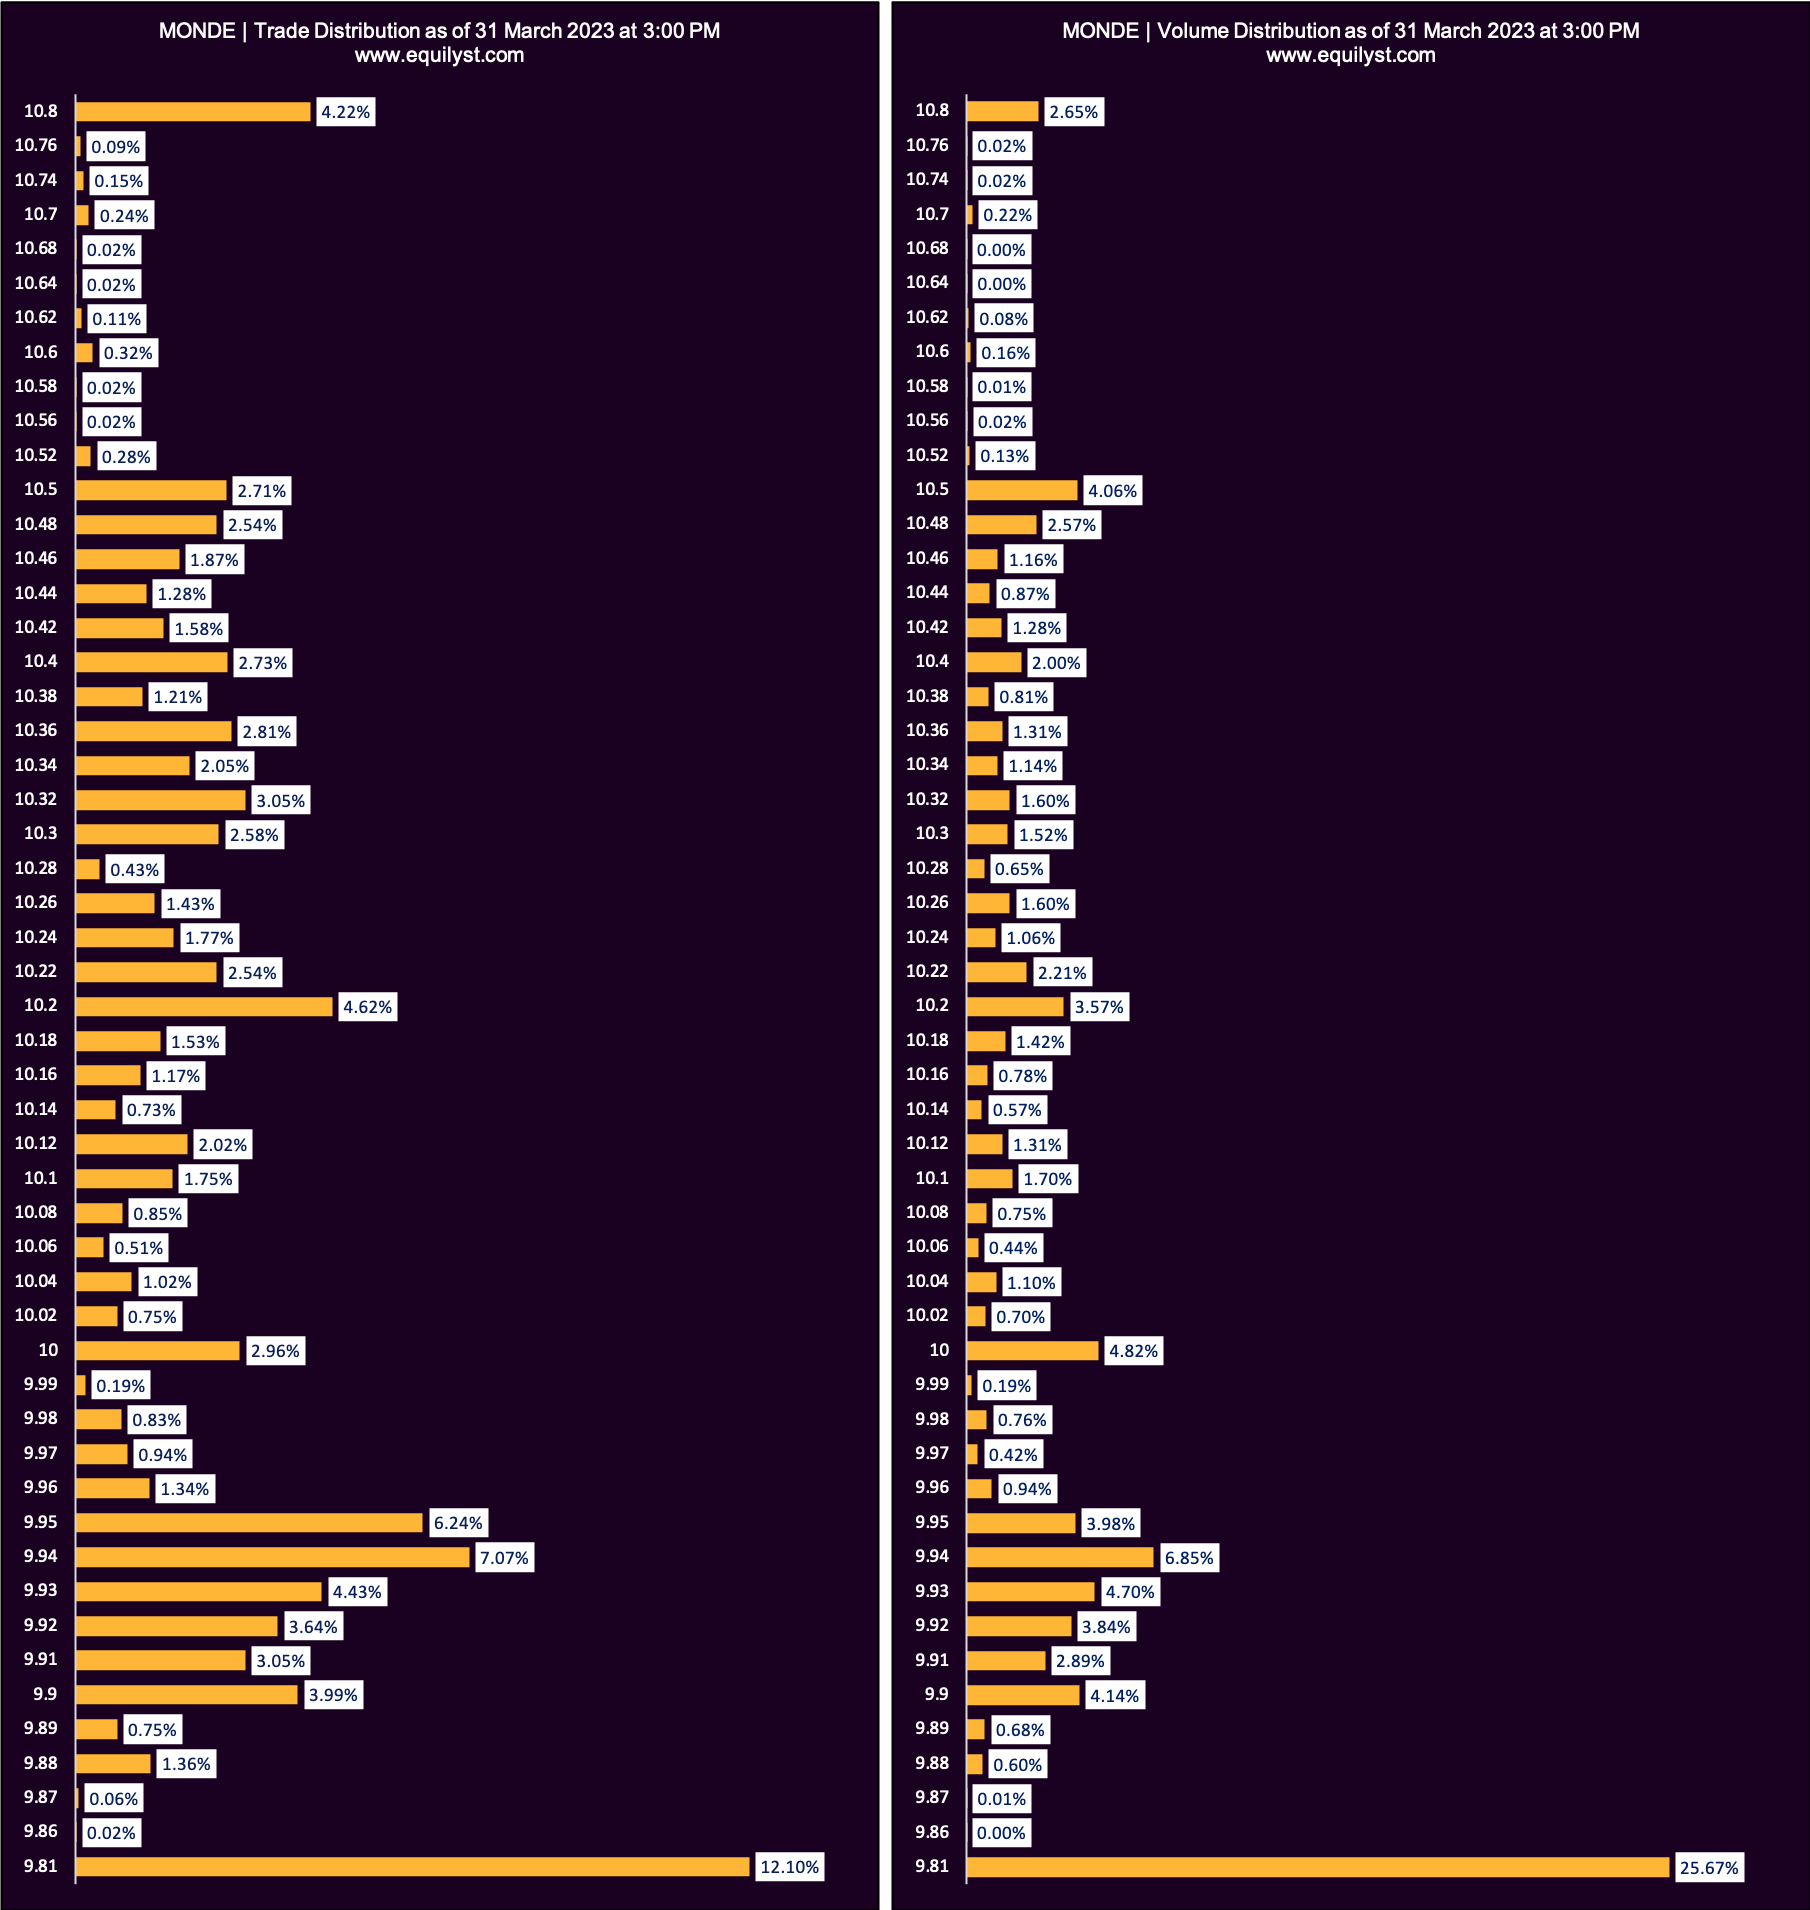
Monde Nissin Corporation (MONDE)
Dominant Range Index: BEARISH
Last Price: 9.81
VWAP: 10.06
Dominant Range: 9.81 – 9.81
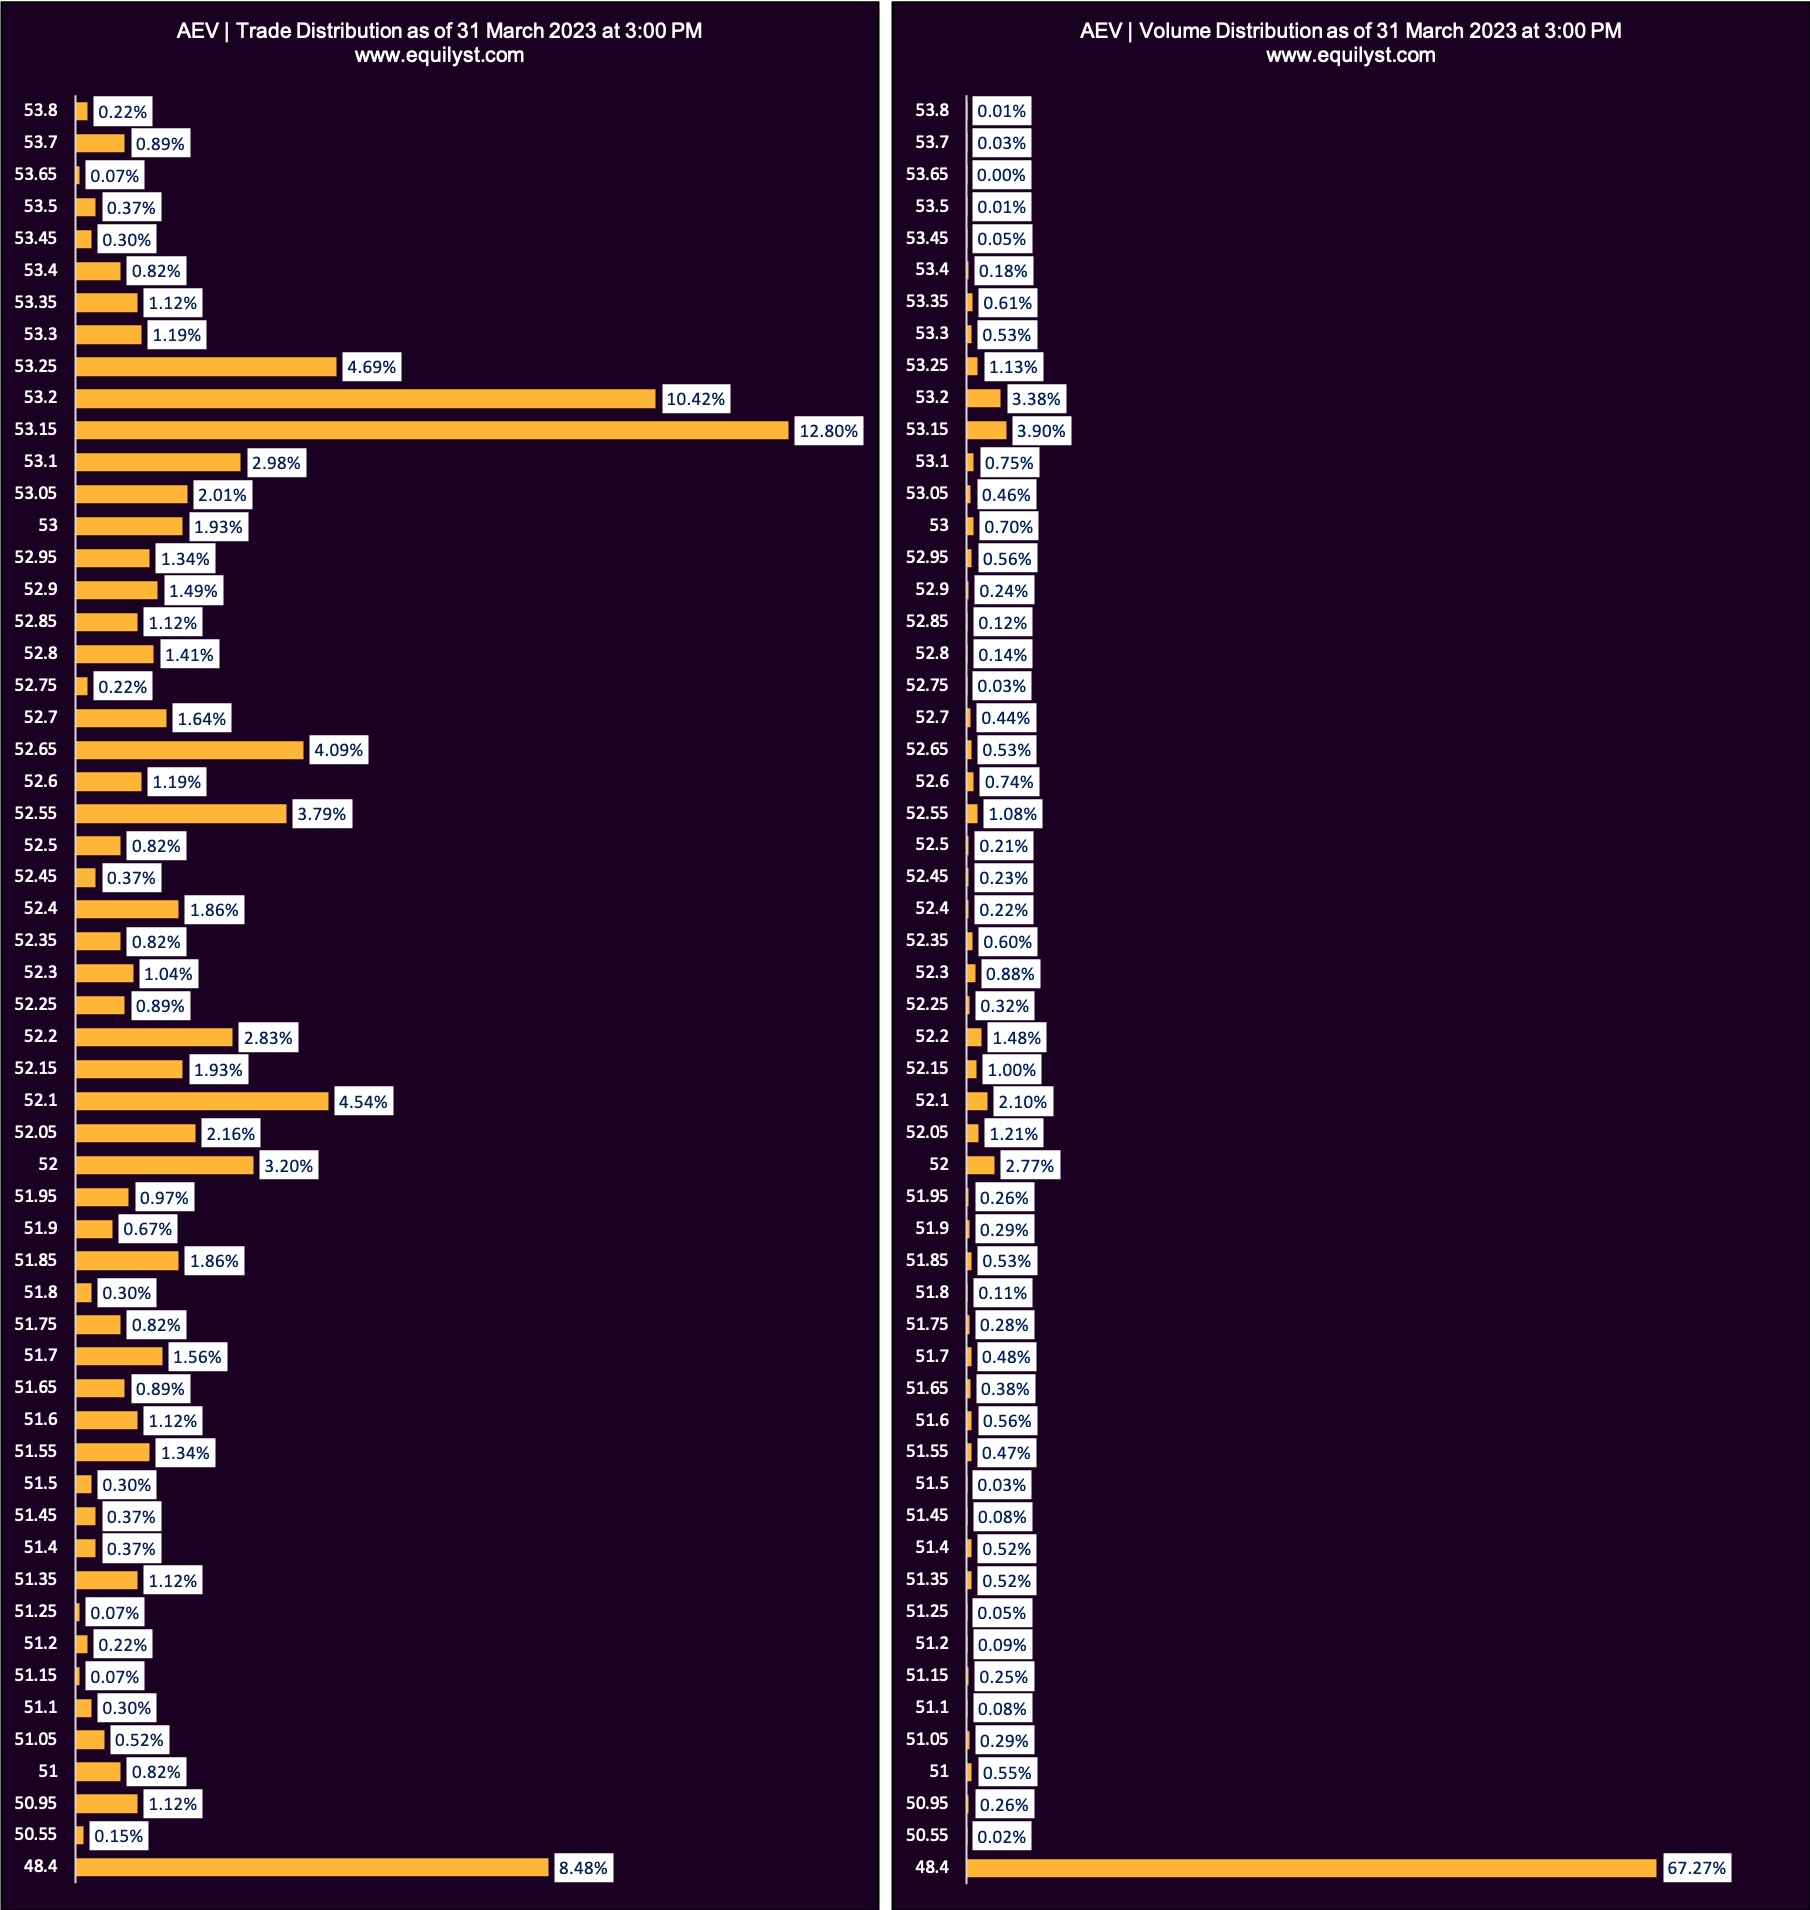
Aboitiz Equity Ventures (AEV)
Dominant Range Index: BEARISH
Last Price: 48.4
VWAP: 49.73
Dominant Range: 48.4 – 53.15
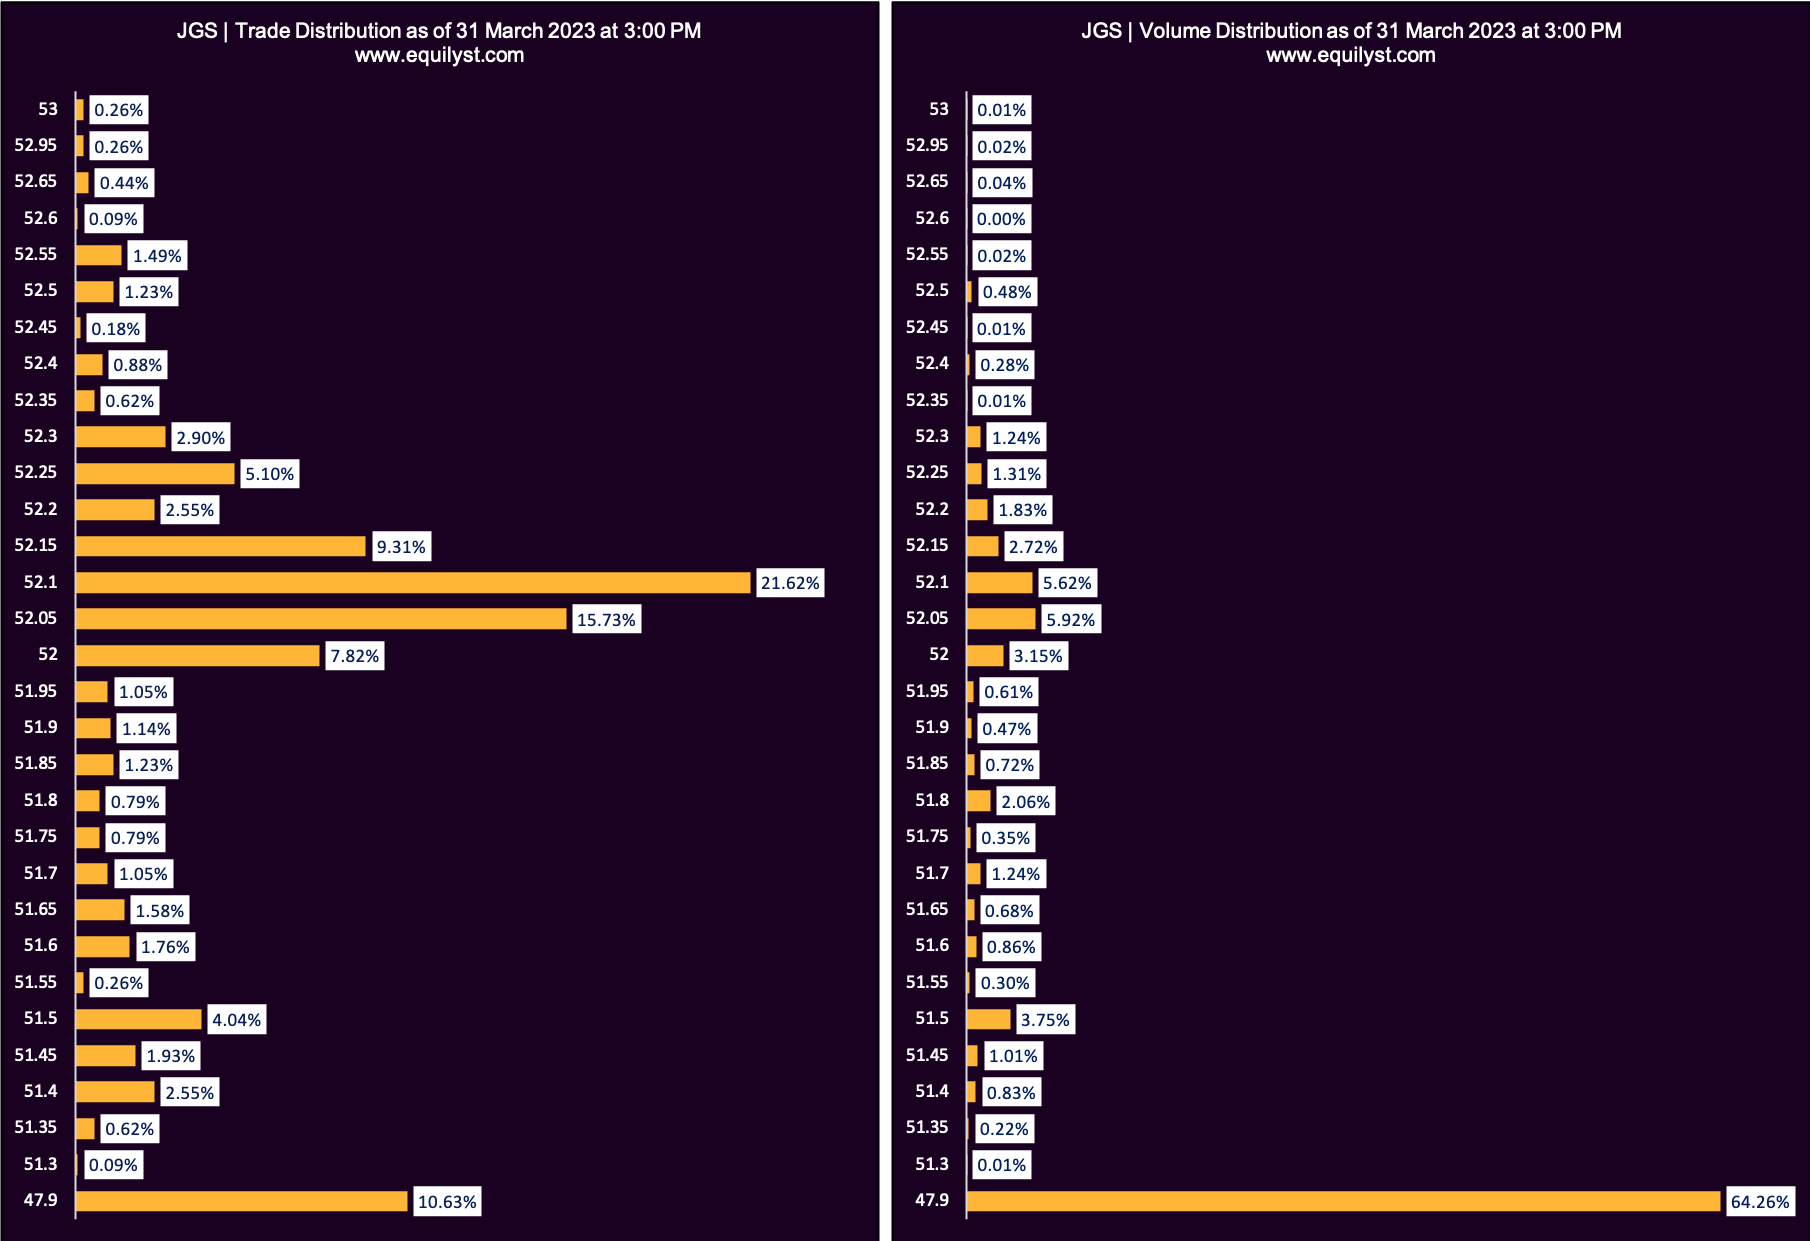
JG Summit Holdings (JGS)
Dominant Range Index: BEARISH
Last Price: 47.9
VWAP: 49.34
Dominant Range: 47.9 – 52.1
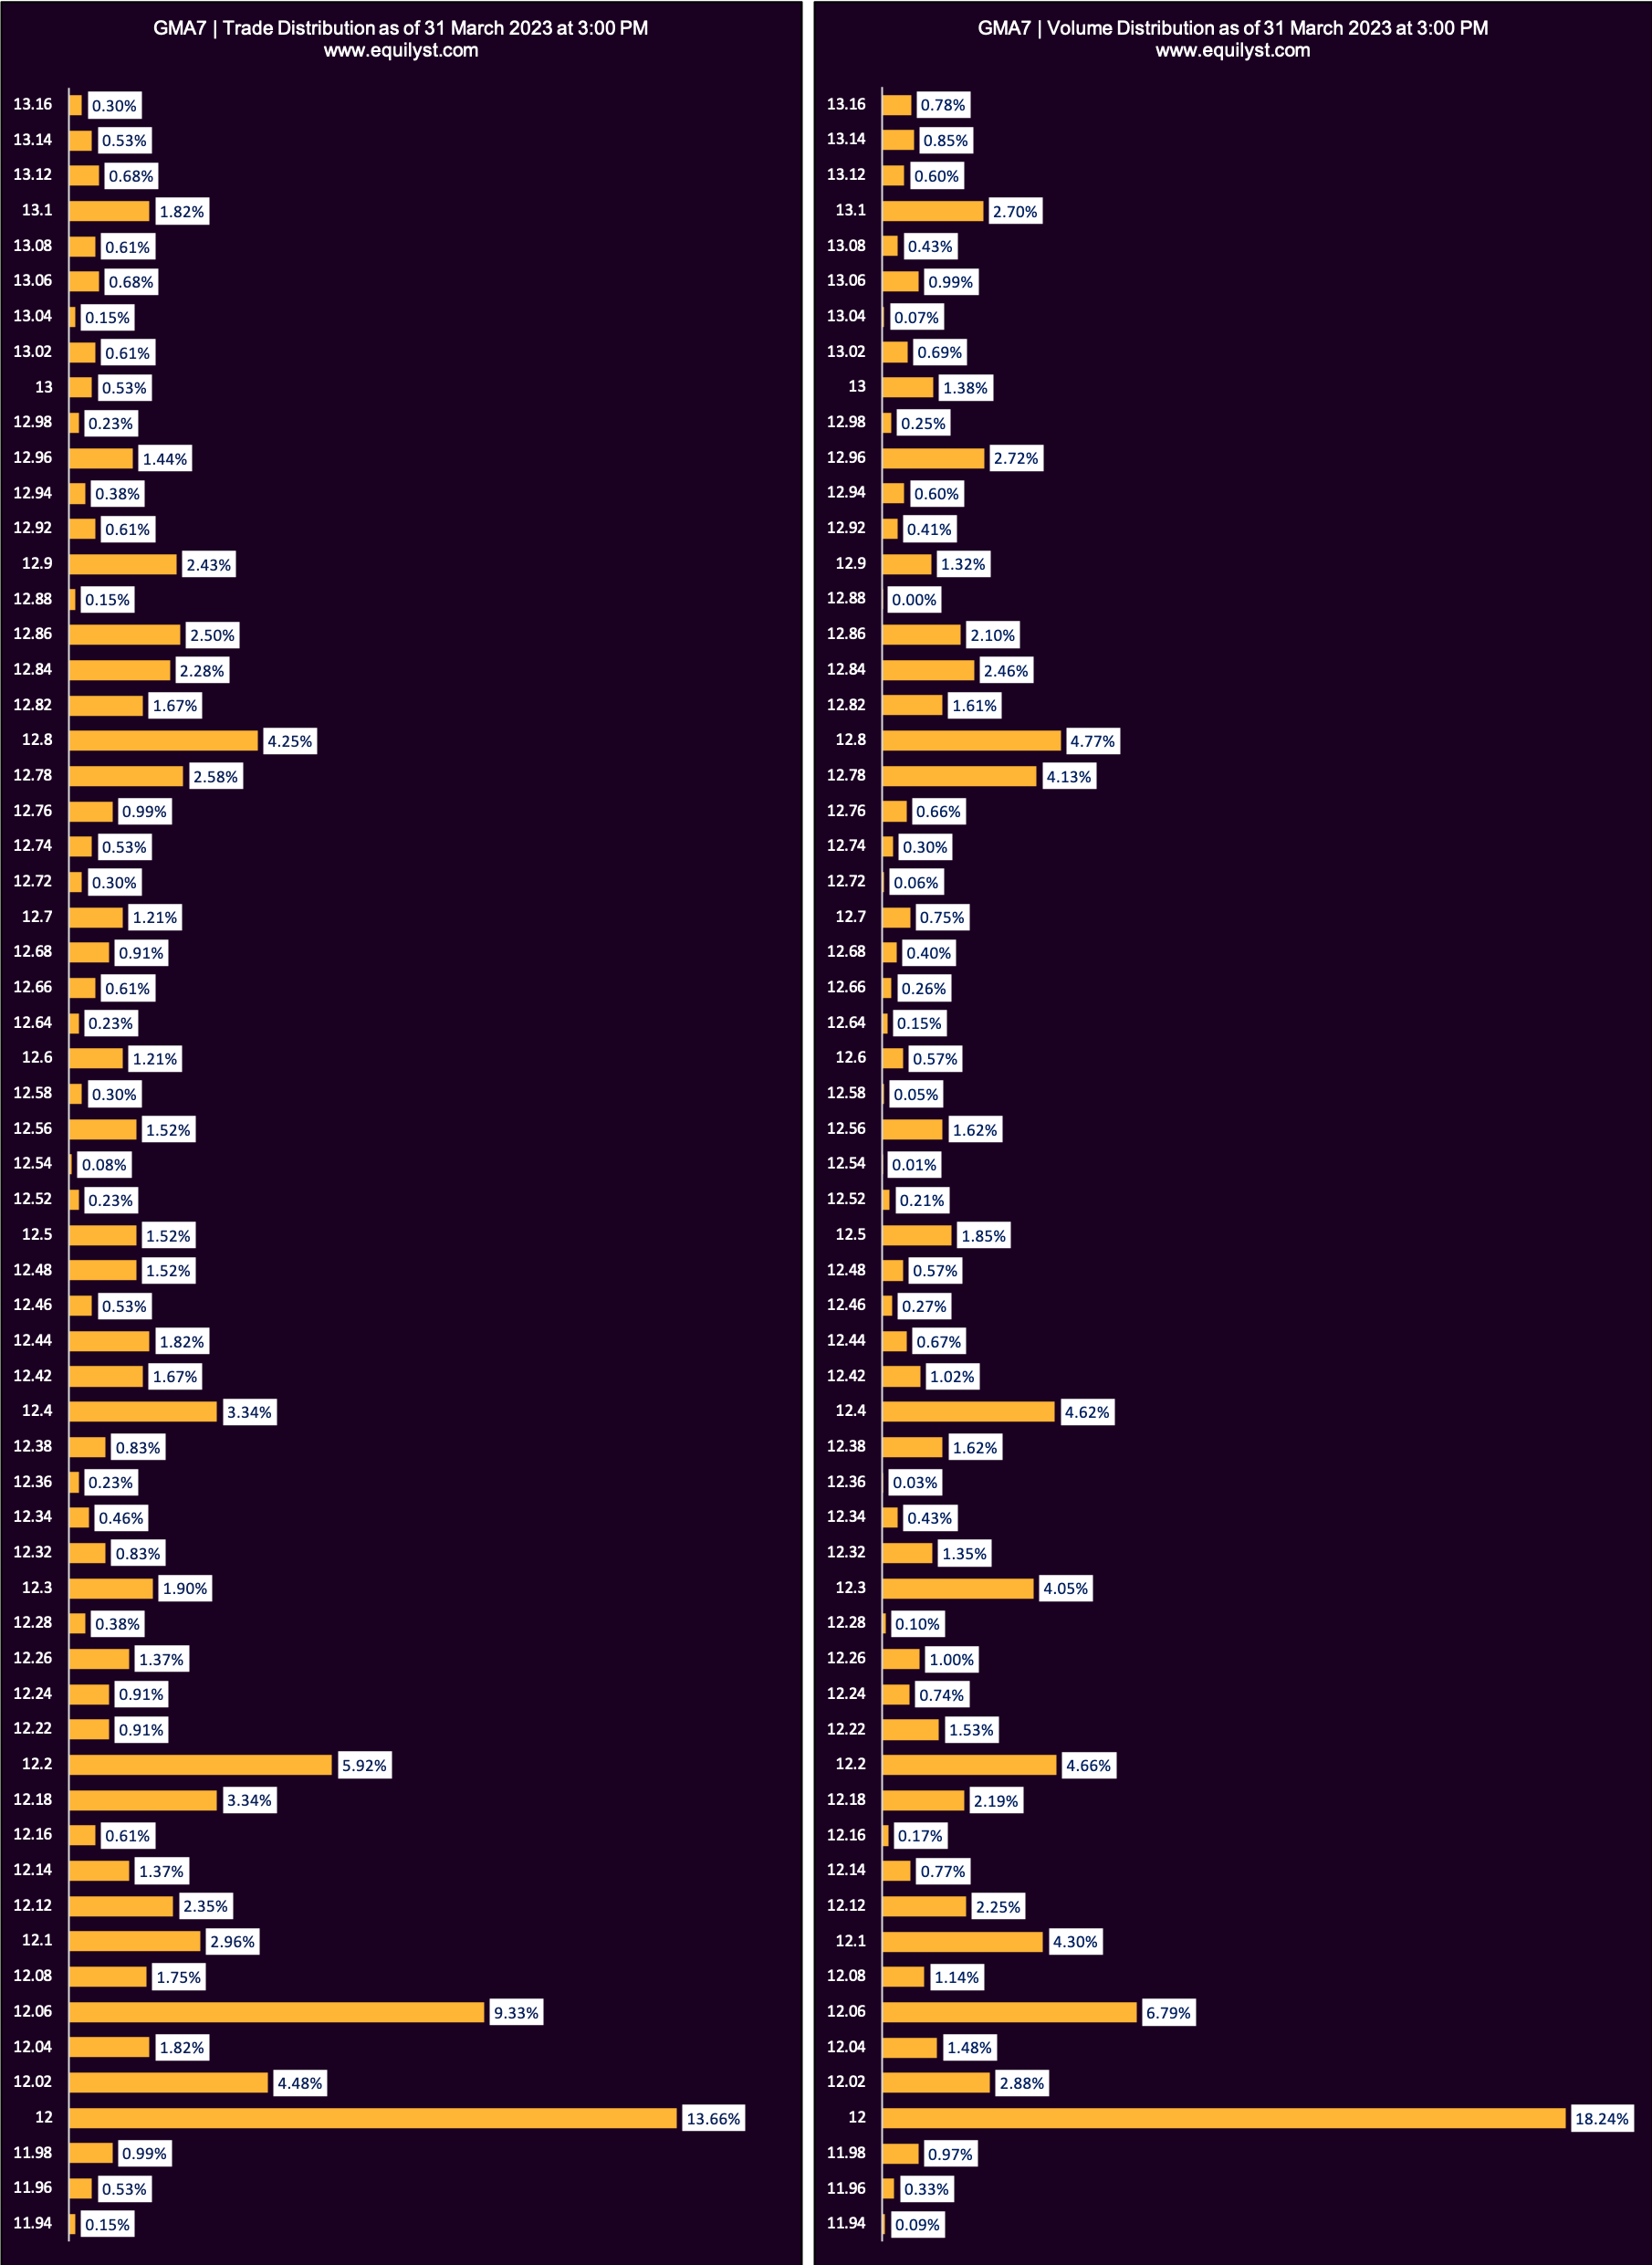
GMA Network (GMA7)
Dominant Range Index: BEARISH
Last Price: 12.06
VWAP: 12.39
Dominant Range: 12 – 12
SM Prime Holdings (SMPH)
Dominant Range Index: BEARISH
Last Price: 32.8
VWAP: 33.05
Dominant Range: 32.8 – 33.3
Need Help?
Avail of my stock market consultancy service if you need further explanation (a 1-on-1 online workshop) of my Dominant Range Index and the entirety of my Evergreen Strategy When Trading and Investing in the Philippine Stock Market. I’ll teach you how I preserve my capital, protect my gains, and prevent unbearable losses. Contact me.
- MA, BDO, ALI, URC, PX: Is Their Dominant Range Pointing to a Breakout? - March 14, 2025
- Tracking Market Sentiment: MTD Ratings for 30 Bluechip Stocks (March 2025) - March 13, 2025
- PSEi Stalls Below 6,260 as Market Awaits Political Shift - March 12, 2025


